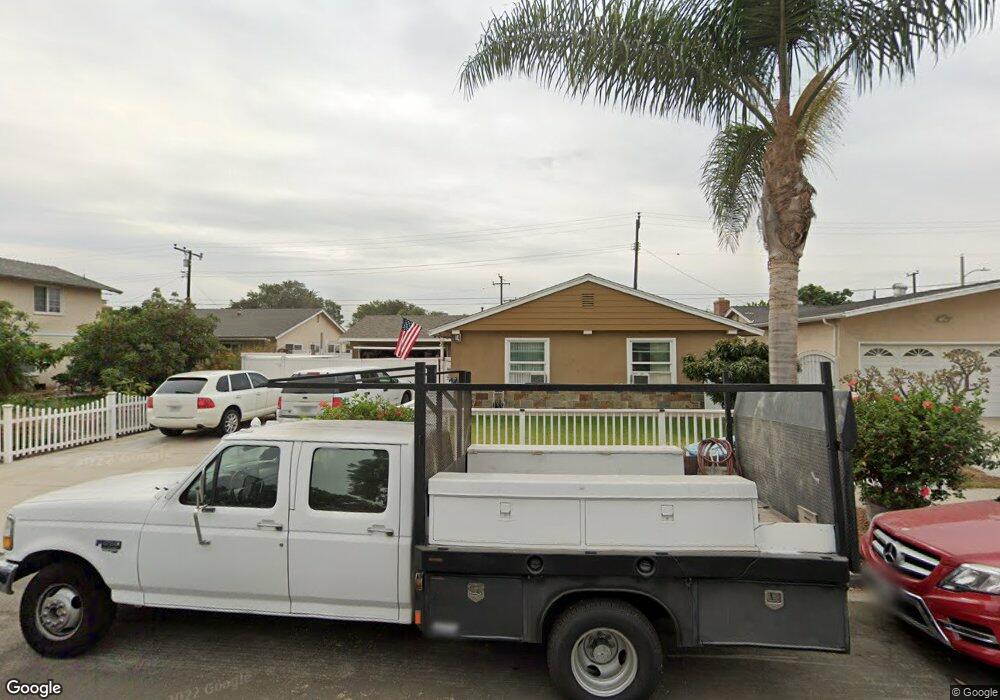
8450 Wells Rd Westminster, CA 92683
Star View NeighborhoodEstimated Value: $973,000 - $1,053,000
3
Beds
2
Baths
1,453
Sq Ft
$692/Sq Ft
Est. Value
About This Home
This home is located at 8450 Wells Rd, Westminster, CA 92683 and is currently estimated at $1,005,947, approximately $692 per square foot. 8450 Wells Rd is a home located in Orange County with nearby schools including Vista View Middle School, Ocean View High, and Sycamore Creek Community Charter School.
Ownership History
Date
Name
Owned For
Owner Type
Purchase Details
Closed on
Jul 1, 2014
Sold by
Anderson Jeff
Bought by
Andreson Jeff and Andreson Sandra
Current Estimated Value
Purchase Details
Closed on
Mar 2, 2004
Sold by
Andreson Sandra
Bought by
Anderson Jeff
Home Financials for this Owner
Home Financials are based on the most recent Mortgage that was taken out on this home.
Original Mortgage
$242,000
Interest Rate
5%
Mortgage Type
New Conventional
Purchase Details
Closed on
Dec 22, 2000
Sold by
Andreson Sandra
Bought by
Andreson Jeff
Home Financials for this Owner
Home Financials are based on the most recent Mortgage that was taken out on this home.
Original Mortgage
$160,000
Interest Rate
7.71%
Purchase Details
Closed on
Dec 14, 2000
Sold by
Andreson Kristy
Bought by
Andreson Jeff
Home Financials for this Owner
Home Financials are based on the most recent Mortgage that was taken out on this home.
Original Mortgage
$160,000
Interest Rate
7.71%
Create a Home Valuation Report for This Property
The Home Valuation Report is an in-depth analysis detailing your home's value as well as a comparison with similar homes in the area
Home Values in the Area
Average Home Value in this Area
Purchase History
| Date | Buyer | Sale Price | Title Company |
|---|---|---|---|
| Andreson Jeff | -- | None Available | |
| Anderson Jeff | -- | Ticor Title Company Of Ca | |
| Andreson Jeff | -- | Southland Title Corporation | |
| Andreson Jeff | $200,000 | Southland Title Corporation |
Source: Public Records
Mortgage History
| Date | Status | Borrower | Loan Amount |
|---|---|---|---|
| Closed | Anderson Jeff | $242,000 | |
| Closed | Andreson Jeff | $160,000 | |
| Closed | Anderson Jeff | $50,500 |
Source: Public Records
Tax History
| Year | Tax Paid | Tax Assessment Tax Assessment Total Assessment is a certain percentage of the fair market value that is determined by local assessors to be the total taxable value of land and additions on the property. | Land | Improvement |
|---|---|---|---|---|
| 2025 | $4,846 | $391,771 | $296,443 | $95,328 |
| 2024 | $4,846 | $384,090 | $290,631 | $93,459 |
| 2023 | $4,732 | $376,559 | $284,932 | $91,627 |
| 2022 | $4,657 | $369,176 | $279,345 | $89,831 |
| 2021 | $4,555 | $361,938 | $273,868 | $88,070 |
| 2020 | $4,507 | $358,227 | $271,060 | $87,167 |
| 2019 | $4,436 | $351,203 | $265,745 | $85,458 |
| 2018 | $4,344 | $344,317 | $260,534 | $83,783 |
| 2017 | $4,280 | $337,566 | $255,425 | $82,141 |
| 2016 | $4,118 | $330,948 | $250,417 | $80,531 |
| 2015 | $4,059 | $325,977 | $246,655 | $79,322 |
| 2014 | $3,911 | $319,592 | $241,823 | $77,769 |
Source: Public Records
Map
Nearby Homes
- 16551 Ross Ln
- 16772 Glenhaven Ln
- 16781 Scotsdale Cir
- 15942 Topaz St
- 7822 Rhine Dr
- 16502 Loire Cir
- 8561 Glasgow Cir
- 16673 Arbor Cir
- 7622 Don Dr
- 16561 Walnut St
- 17091 B Ln
- 15621 Beach Blvd Unit 19
- 15621 Beach Blvd Unit 28
- 15621 Beach Blvd Unit 103
- 15621 Beach Blvd Unit 23
- 15621 Beach Blvd Unit 64
- 15621 Beach Blvd Unit 35
- 15621 Beach Blvd Unit 160
- 15621 Beach Blvd Unit 108
- 15621 Beach Blvd Unit 80
- 8460 Wells Rd
- 8440 Wells Rd
- 8470 Wells Rd
- 8431 Wells Rd
- 16330 Woodruff St
- 8420 Wells Rd
- 16331 Jody Cir
- 8421 Wells Rd
- 8480 Wells Rd
- 16321 Jody Cir
- 16340 Woodruff St
- 8410 Wells Rd
- 8411 Wells Rd
- 16341 Jody Cir
- 16331 Woodruff St
- 16350 Woodruff St
- 8401 Wells Rd
- 8400 Wells Rd
- 16320 Jody Cir
- 16341 Woodruff St
Your Personal Tour Guide
Ask me questions while you tour the home.