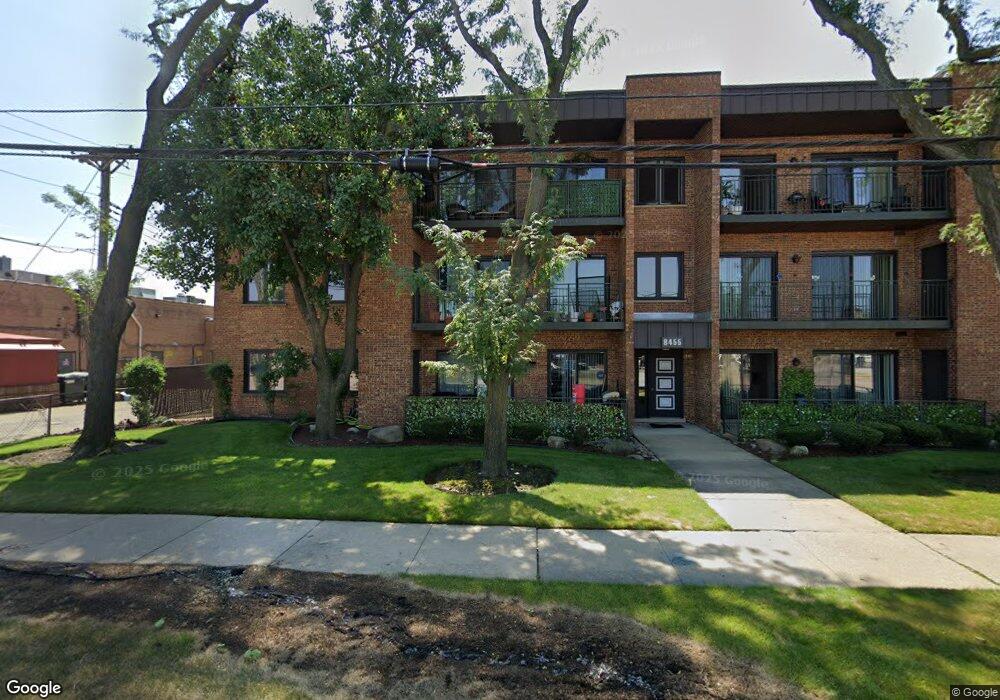
8455 W Lawrence Ave Unit 84551 Chicago, IL 60656
Schorsch Forest View NeighborhoodEstimated Value: $245,000 - $278,000
--
Bed
--
Bath
--
Sq Ft
0.99
Acres
About This Home
This home is located at 8455 W Lawrence Ave Unit 84551, Chicago, IL 60656 and is currently estimated at $265,088. 8455 W Lawrence Ave Unit 84551 is a home located in Cook County with nearby schools including Dirksen Elementary School, William Howard Taft High School, and St Eugene School.
Ownership History
Date
Name
Owned For
Owner Type
Purchase Details
Closed on
Jan 12, 2018
Sold by
Williams Judith F and Williams Gary L
Bought by
Giannopoulos Giannopoulos Angelis Angelis and Giannopoulos Dalip Drita
Current Estimated Value
Home Financials for this Owner
Home Financials are based on the most recent Mortgage that was taken out on this home.
Original Mortgage
$171,000
Outstanding Balance
$147,586
Interest Rate
4.87%
Mortgage Type
New Conventional
Estimated Equity
$117,502
Purchase Details
Closed on
Dec 8, 2007
Sold by
Williams Gary L and Williams Judith E
Bought by
Williams Gary L and Williams Judith E
Purchase Details
Closed on
Jan 14, 2000
Sold by
Doyle Michael E
Bought by
Williams Gary L and Williams Judith E
Purchase Details
Closed on
Apr 28, 1999
Sold by
Doyle John and Will Of Edward Doyle
Bought by
Doyle Michael E
Create a Home Valuation Report for This Property
The Home Valuation Report is an in-depth analysis detailing your home's value as well as a comparison with similar homes in the area
Home Values in the Area
Average Home Value in this Area
Purchase History
| Date | Buyer | Sale Price | Title Company |
|---|---|---|---|
| Giannopoulos Giannopoulos Angelis Angelis | $180,000 | Chicago Title | |
| Williams Gary L | -- | None Available | |
| Williams Gary L | $140,000 | -- | |
| Doyle Michael E | -- | -- |
Source: Public Records
Mortgage History
| Date | Status | Borrower | Loan Amount |
|---|---|---|---|
| Open | Giannopoulos Giannopoulos Angelis Angelis | $171,000 |
Source: Public Records
Tax History Compared to Growth
Tax History
| Year | Tax Paid | Tax Assessment Tax Assessment Total Assessment is a certain percentage of the fair market value that is determined by local assessors to be the total taxable value of land and additions on the property. | Land | Improvement |
|---|---|---|---|---|
| 2024 | $2,676 | $22,502 | $4,366 | $18,136 |
| 2023 | $2,587 | $16,000 | $3,493 | $12,507 |
| 2022 | $2,587 | $16,000 | $3,493 | $12,507 |
| 2021 | $2,548 | $15,999 | $3,492 | $12,507 |
| 2020 | $2,078 | $12,432 | $2,183 | $10,249 |
| 2019 | $2,083 | $13,799 | $2,183 | $11,616 |
| 2018 | $2,726 | $13,799 | $2,183 | $11,616 |
| 2017 | $2,336 | $10,853 | $1,921 | $8,932 |
| 2016 | $1,316 | $10,853 | $1,921 | $8,932 |
| 2015 | $1,165 | $10,853 | $1,921 | $8,932 |
| 2014 | $1,229 | $11,028 | $1,833 | $9,195 |
| 2013 | $1,186 | $11,028 | $1,833 | $9,195 |
Source: Public Records
Map
Nearby Homes
- 4623 N Chester Ave Unit 110W
- 4624 N Commons Dr Unit 405E
- 4624 N Commons Dr Unit 111E
- 4621 N Anthon Ave
- 8423 W Wilson Ave
- 4900 N Ridgewood Ave
- 8268 W Lawrence Ave
- 8542 W Winnemac Ave
- 8517 W Carmen Ave
- 8200 W Eastwood Ave
- 8500 W Carmen Ave
- 4519 N Reserve Ave
- 4938 N Leonard Dr Unit 1B
- 8434 W Brodman Ave
- 8600 W Brodman Ave
- 8449 W Brodman Ave
- 8025 W Giddings St
- 4456 N Forestview Ave
- 8631 W Foster Ave
- 5037 N East River Rd Unit 1B
- 8455 W Lawrence Ave Unit 3A
- 8455 W Lawrence Ave Unit 1D
- 8455 W Lawrence Ave Unit 84553
- 8455 W Lawrence Ave Unit 84551
- 8455 W Lawrence Ave Unit 84553
- 8455 W Lawrence Ave Unit 84552
- 8455 W Lawrence Ave Unit 84552
- 8455 W Lawrence Ave Unit 84553
- 8455 W Lawrence Ave Unit 84552
- 8455 W Lawrence Ave Unit 84552
- 8455 W Lawrence Ave Unit 84551
- 8455 W Lawrence Ave Unit 84551
- 8455 W Lawrence Ave Unit 84553
- 8455 W Lawrence Ave Unit 2B
- 8455 W Lawrence Ave Unit 2D
- 8455 W Lawrence Ave Unit 3D
- 8455 W Lawrence Ave Unit 3-D
- 8455 W Lawrence Ave Unit 2A
- 8455 W Lawrence Ave Unit 1C
- 8455 W Lawrence Ave Unit 1A