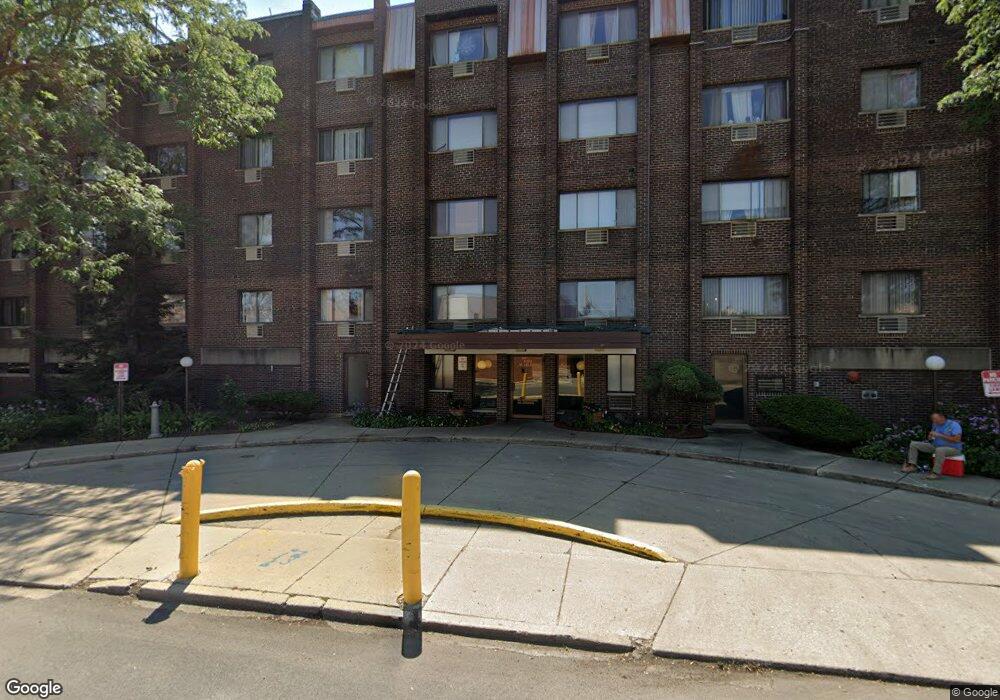
8455 W Leland Ave Unit 312N Chicago, IL 60656
Schorsch Forest View NeighborhoodEstimated Value: $106,000 - $124,000
--
Bed
--
Bath
--
Sq Ft
3.02
Acres
About This Home
This home is located at 8455 W Leland Ave Unit 312N, Chicago, IL 60656 and is currently estimated at $115,114. 8455 W Leland Ave Unit 312N is a home located in Cook County with nearby schools including Dirksen Elementary School, William Howard Taft High School, and St Eugene School.
Ownership History
Date
Name
Owned For
Owner Type
Purchase Details
Closed on
Dec 18, 2023
Sold by
Chicago Title Land Trust Co
Bought by
Leybovich Leonid B
Current Estimated Value
Purchase Details
Closed on
Mar 11, 2020
Sold by
Ogorzalek Malgorzata
Bought by
Chicago Title Land Trust Company and Trust Number 8002382991
Purchase Details
Closed on
May 3, 2019
Sold by
Olszynski Waclaw
Bought by
Ogorzalek Malgorzata
Purchase Details
Closed on
Dec 8, 2000
Sold by
Olszynska Helena
Bought by
Olszynski Waclaw
Purchase Details
Closed on
Oct 30, 1998
Sold by
Alvord Robert J and Alvord Eleanor A
Bought by
Olszynska Helena
Home Financials for this Owner
Home Financials are based on the most recent Mortgage that was taken out on this home.
Original Mortgage
$48,000
Interest Rate
6.68%
Purchase Details
Closed on
Nov 28, 1995
Sold by
Gustafson Kenneth E
Bought by
Alvord Robert J and Alvord Eleanor R
Create a Home Valuation Report for This Property
The Home Valuation Report is an in-depth analysis detailing your home's value as well as a comparison with similar homes in the area
Home Values in the Area
Average Home Value in this Area
Purchase History
| Date | Buyer | Sale Price | Title Company |
|---|---|---|---|
| Leybovich Leonid B | $95,000 | Chicago Title | |
| Chicago Title Land Trust Company | -- | Chicago Title | |
| Ogorzalek Malgorzata | -- | Attorney | |
| Olszynski Waclaw | -- | -- | |
| Olszynska Helena | $60,000 | Professional National Title | |
| Alvord Robert J | $58,000 | -- |
Source: Public Records
Mortgage History
| Date | Status | Borrower | Loan Amount |
|---|---|---|---|
| Previous Owner | Olszynska Helena | $48,000 |
Source: Public Records
Tax History Compared to Growth
Tax History
| Year | Tax Paid | Tax Assessment Tax Assessment Total Assessment is a certain percentage of the fair market value that is determined by local assessors to be the total taxable value of land and additions on the property. | Land | Improvement |
|---|---|---|---|---|
| 2024 | $799 | $8,156 | $1,023 | $7,133 |
| 2023 | $757 | $7,104 | $821 | $6,283 |
| 2022 | $757 | $7,104 | $821 | $6,283 |
| 2021 | $759 | $7,103 | $820 | $6,283 |
| 2020 | $401 | $4,903 | $511 | $4,392 |
| 2019 | $404 | $5,442 | $511 | $4,931 |
| 2018 | $396 | $5,442 | $511 | $4,931 |
| 2017 | $65 | $3,677 | $449 | $3,228 |
| 2016 | $236 | $3,677 | $449 | $3,228 |
| 2015 | $193 | $3,677 | $449 | $3,228 |
| 2014 | $178 | $3,526 | $429 | $3,097 |
| 2013 | $163 | $3,526 | $429 | $3,097 |
Source: Public Records
Map
Nearby Homes
- 4623 N Chester Ave Unit 110W
- 4624 N Commons Dr Unit 405E
- 4624 N Commons Dr Unit 111E
- 4615 N Maria Ct
- 8423 W Wilson Ave
- 4621 N Anthon Ave
- 8268 W Lawrence Ave
- 8200 W Eastwood Ave
- 8434 W Brodman Ave
- 4900 N Ridgewood Ave
- 8449 W Brodman Ave
- 4519 N Reserve Ave
- 8600 W Brodman Ave
- 8542 W Winnemac Ave
- 8517 W Carmen Ave
- 8255 W Agatite Ave
- 8025 W Giddings St
- 4456 N Forestview Ave
- 8500 W Carmen Ave
- 4938 N Leonard Dr Unit 1B
- 8455 W Leland Ave Unit 410N
- 8455 W Leland Ave Unit 413
- 8455 W Leland Ave Unit 407N
- 8455 W Leland Ave Unit 405N
- 8455 W Leland Ave Unit 313N
- 8455 W Leland Ave Unit 307N
- 8455 W Leland Ave Unit 301
- 8455 W Leland Ave Unit 208N
- 8455 W Leland Ave Unit 203N
- 8455 W Leland Ave Unit 201N
- 8455 W Leland Ave Unit 113N
- 8455 W Leland Ave Unit 111N
- 8455 W Leland Ave Unit 108N
- 8455 W Leland Ave Unit 402N
- 8455 W Leland Ave Unit 302N
- 8455 W Leland Ave Unit 409N
- 8455 W Leland Ave Unit 210N
- 8455 W Leland Ave Unit 202N
- 8455 W Leland Ave Unit 209N
- 8455 W Leland Ave Unit 106N