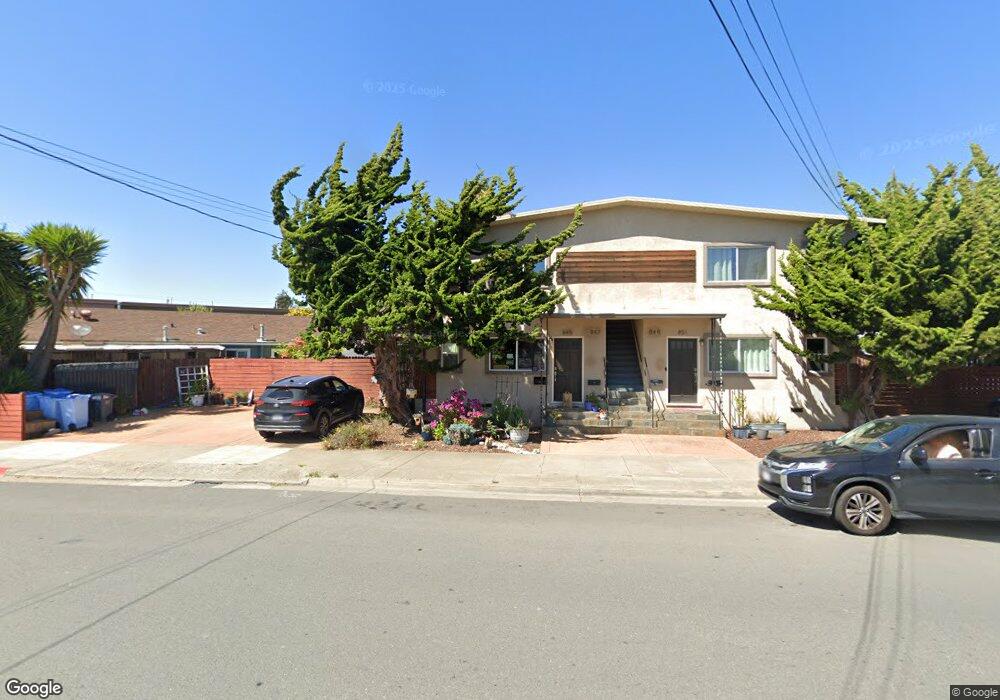
847 Dwight Crescent Berkeley, CA 94710
West Berkeley NeighborhoodEstimated Value: $475,000 - $751,000
2
Beds
1
Bath
650
Sq Ft
$935/Sq Ft
Est. Value
About This Home
This home is located at 847 Dwight Crescent, Berkeley, CA 94710 and is currently estimated at $607,554, approximately $934 per square foot. 847 Dwight Crescent is a home located in Alameda County with nearby schools including Rosa Parks Elementary School, Ruth Acty Elementary, and Berkeley Arts Magnet at Whittier School.
Ownership History
Date
Name
Owned For
Owner Type
Purchase Details
Closed on
Jul 14, 2015
Sold by
Bradley Michael Casey
Bought by
Kirby Marlen J and Dobson Jessica W
Current Estimated Value
Home Financials for this Owner
Home Financials are based on the most recent Mortgage that was taken out on this home.
Original Mortgage
$359,250
Outstanding Balance
$280,024
Interest Rate
3.85%
Mortgage Type
New Conventional
Estimated Equity
$327,530
Purchase Details
Closed on
Jun 17, 2015
Sold by
Bradley Michael Casey
Bought by
Bradley Michael Casey
Home Financials for this Owner
Home Financials are based on the most recent Mortgage that was taken out on this home.
Original Mortgage
$359,250
Outstanding Balance
$280,024
Interest Rate
3.85%
Mortgage Type
New Conventional
Estimated Equity
$327,530
Create a Home Valuation Report for This Property
The Home Valuation Report is an in-depth analysis detailing your home's value as well as a comparison with similar homes in the area
Home Values in the Area
Average Home Value in this Area
Purchase History
| Date | Buyer | Sale Price | Title Company |
|---|---|---|---|
| Kirby Marlen J | $479,000 | First American Title Company | |
| Bradley Michael Casey | -- | First American Title Company |
Source: Public Records
Mortgage History
| Date | Status | Borrower | Loan Amount |
|---|---|---|---|
| Open | Kirby Marlen J | $359,250 | |
| Closed | Bradley Michael Casey | $38,000 |
Source: Public Records
Tax History
| Year | Tax Paid | Tax Assessment Tax Assessment Total Assessment is a certain percentage of the fair market value that is determined by local assessors to be the total taxable value of land and additions on the property. | Land | Improvement |
|---|---|---|---|---|
| 2025 | $8,034 | $567,025 | $142,052 | $424,973 |
| 2024 | $8,034 | $555,908 | $139,267 | $416,641 |
| 2023 | $7,873 | $545,010 | $136,537 | $408,473 |
| 2022 | $7,750 | $534,324 | $133,860 | $400,464 |
| 2021 | $7,778 | $523,848 | $131,235 | $392,613 |
| 2020 | $7,424 | $518,478 | $129,890 | $388,588 |
| 2019 | $7,197 | $508,314 | $127,344 | $380,970 |
| 2018 | $7,088 | $498,351 | $124,848 | $373,503 |
| 2017 | $6,832 | $488,580 | $122,400 | $366,180 |
| 2016 | $6,557 | $479,000 | $120,000 | $359,000 |
Source: Public Records
Map
Nearby Homes
- 2512 9th St Unit 10
- 2238 7th St
- 931 Bancroft Way
- 2220 7th St
- 2327 10th St Unit 4
- 1039 Channing Way
- 2241 Ninth St
- 1092 Dwight Way
- 1050 Allston Way
- 1118 Dwight Way
- 1142 Dwight Way
- 2324 Browning St
- 1013 Addison St
- 2013 9th St
- 2144 Curtis St
- 1034 Grayson St
- 2747 San Pablo Ave Unit 507
- 2751 Wallace St
- 817 Delaware St
- 940 Delaware St
Your Personal Tour Guide
Ask me questions while you tour the home.