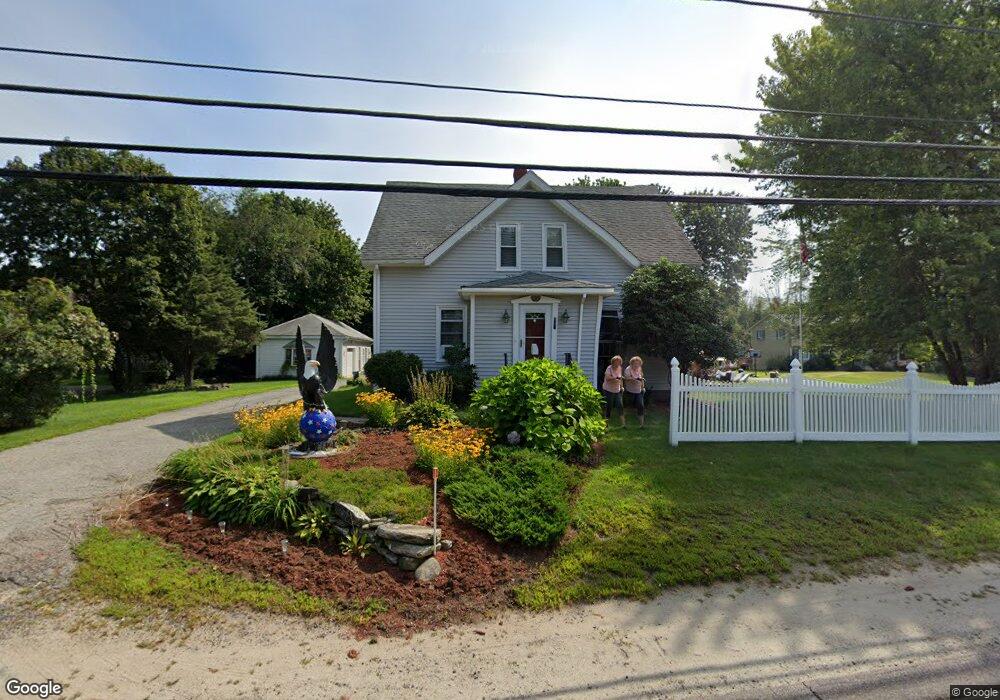
847 S Main St Bellingham, MA 02019
Estimated Value: $513,510 - $703,000
3
Beds
2
Baths
2,213
Sq Ft
$267/Sq Ft
Est. Value
About This Home
This home is located at 847 S Main St, Bellingham, MA 02019 and is currently estimated at $590,128, approximately $266 per square foot. 847 S Main St is a home located in Norfolk County with nearby schools including Joseph F. DiPietro Elementary, Bellingham High School, and Rise Prep Mayoral Academy Middle School.
Ownership History
Date
Name
Owned For
Owner Type
Purchase Details
Closed on
Dec 10, 2025
Sold by
Hand Patricia
Bought by
Patricia A Hand Lt and Hand
Current Estimated Value
Purchase Details
Closed on
Sep 13, 1982
Bought by
Hand William and Hand Patricia
Create a Home Valuation Report for This Property
The Home Valuation Report is an in-depth analysis detailing your home's value as well as a comparison with similar homes in the area
Home Values in the Area
Average Home Value in this Area
Purchase History
| Date | Buyer | Sale Price | Title Company |
|---|---|---|---|
| Patricia A Hand Lt | -- | -- | |
| Hand William | $40,000 | -- |
Source: Public Records
Mortgage History
| Date | Status | Borrower | Loan Amount |
|---|---|---|---|
| Previous Owner | Hand William | $92,000 | |
| Previous Owner | Hand William | $86,800 | |
| Previous Owner | Hand William | $88,800 |
Source: Public Records
Tax History
| Year | Tax Paid | Tax Assessment Tax Assessment Total Assessment is a certain percentage of the fair market value that is determined by local assessors to be the total taxable value of land and additions on the property. | Land | Improvement |
|---|---|---|---|---|
| 2025 | $5,029 | $400,400 | $132,000 | $268,400 |
| 2024 | $4,826 | $375,300 | $120,500 | $254,800 |
| 2023 | $4,652 | $356,500 | $114,800 | $241,700 |
| 2022 | $4,563 | $324,100 | $95,700 | $228,400 |
| 2021 | $4,394 | $304,900 | $95,700 | $209,200 |
| 2020 | $4,255 | $299,200 | $95,700 | $203,500 |
| 2019 | $4,162 | $292,900 | $95,700 | $197,200 |
| 2018 | $3,970 | $275,500 | $96,500 | $179,000 |
| 2017 | $3,856 | $268,900 | $96,500 | $172,400 |
| 2016 | $3,673 | $257,000 | $100,400 | $156,600 |
| 2015 | $3,528 | $247,600 | $96,500 | $151,100 |
| 2014 | $3,521 | $240,200 | $93,200 | $147,000 |
Source: Public Records
Map
Nearby Homes
- 36 Indian Run Rd
- 5 Bernier Ln
- 0 North St Unit 73440626
- 11 Quail Run Rd
- 14 Little Tree Ln
- 66 Newland Ave
- 1 Whitman Cir Unit 1
- 3 Whitman Cir Unit 3
- 5 Whitman Cir Unit 5
- 352 Lake St
- 2 Marie Dr
- 125 Blackstone St
- 241 Prospect St
- 67 Blackstone St
- 70 Oswego St
- 7 Debra Ln Unit 1
- 183 Elm St Unit 185
- 185 Elm St
- 1 Evergreen Dr Unit 1
- 101 Pine Grove Ave
- 846 S Main St
- 211 S Main St
- 843 S Main St Unit 1
- 841 S Main St
- 843 S Main St
- 843 S Main St Unit 843
- 853 S Main St
- 855 S Main St
- 853 S Main St Unit 2
- 2 Scott Hill Blvd
- 5 Scott Hill Blvd
- 857 S Main St
- 859 S Main St
- 838 S Main St
- 7 Scott Hill Blvd
- 835 S Main St
- 858 S Main St
- 836 S Main St
- 861 S Main St
- 863 S Main St
Your Personal Tour Guide
Ask me questions while you tour the home.