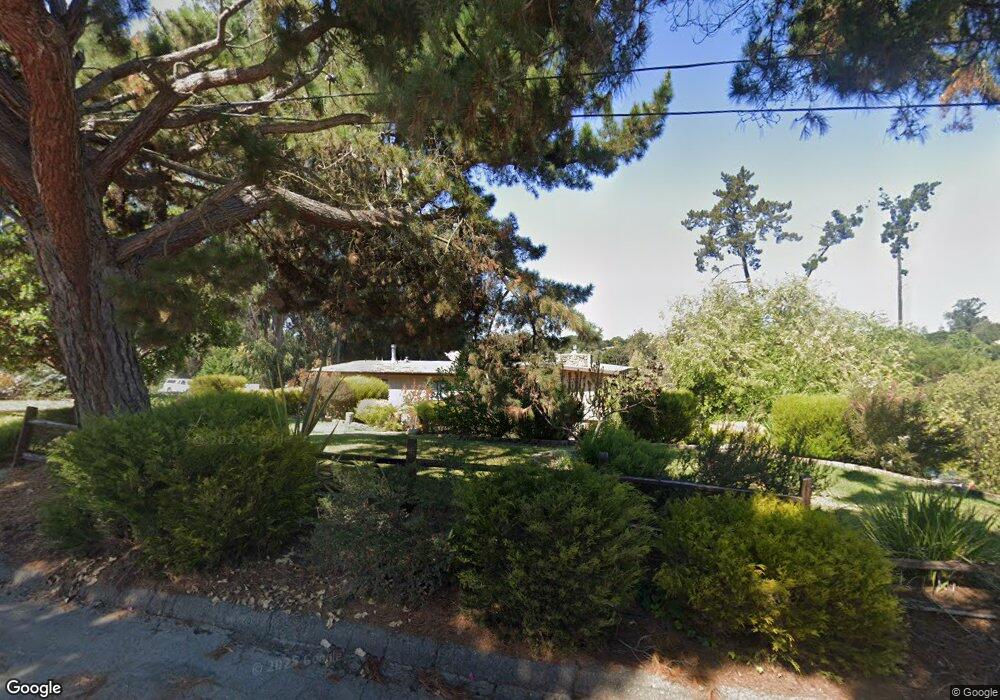
848 Camino Caballo Nipomo, CA 93444
Estimated Value: $915,000 - $1,237,000
4
Beds
3
Baths
2,147
Sq Ft
$517/Sq Ft
Est. Value
About This Home
This home is located at 848 Camino Caballo, Nipomo, CA 93444 and is currently estimated at $1,110,416, approximately $517 per square foot. 848 Camino Caballo is a home located in San Luis Obispo County with nearby schools including Dana Elementary School, Mesa Middle School, and Nipomo High School.
Ownership History
Date
Name
Owned For
Owner Type
Purchase Details
Closed on
Jul 11, 2024
Sold by
Joseph E Sesto Revocable Family Trust and Sesto Sandee L
Bought by
Sesto Sandee L
Current Estimated Value
Purchase Details
Closed on
Oct 2, 2023
Sold by
Madalyn Eve Schwicker Revocable Living T
Bought by
Kremer Darrin Dane and Hay Tamara Lane
Purchase Details
Closed on
Aug 4, 2004
Sold by
Tarr Madalyn E
Bought by
The Madalyn E Tarr Living Trust
Purchase Details
Closed on
Oct 11, 2000
Sold by
Tarr Madalyn E and Tarr Harry L
Bought by
Tarr Madalyn E
Home Financials for this Owner
Home Financials are based on the most recent Mortgage that was taken out on this home.
Original Mortgage
$150,000
Interest Rate
7.9%
Create a Home Valuation Report for This Property
The Home Valuation Report is an in-depth analysis detailing your home's value as well as a comparison with similar homes in the area
Home Values in the Area
Average Home Value in this Area
Purchase History
| Date | Buyer | Sale Price | Title Company |
|---|---|---|---|
| Sesto Sandee L | -- | None Listed On Document | |
| Kremer Darrin Dane | -- | None Listed On Document | |
| The Madalyn E Tarr Living Trust | -- | -- | |
| Tarr Madalyn E | -- | Fidelity National Title Co |
Source: Public Records
Mortgage History
| Date | Status | Borrower | Loan Amount |
|---|---|---|---|
| Previous Owner | Tarr Madalyn E | $150,000 |
Source: Public Records
Tax History Compared to Growth
Tax History
| Year | Tax Paid | Tax Assessment Tax Assessment Total Assessment is a certain percentage of the fair market value that is determined by local assessors to be the total taxable value of land and additions on the property. | Land | Improvement |
|---|---|---|---|---|
| 2025 | $10,156 | $994,500 | $535,500 | $459,000 |
| 2024 | $2,183 | $975,000 | $525,000 | $450,000 |
| 2023 | $2,183 | $213,403 | $69,349 | $144,054 |
| 2022 | $2,149 | $209,220 | $67,990 | $141,230 |
| 2021 | $2,144 | $205,118 | $66,657 | $138,461 |
| 2020 | $2,118 | $203,016 | $65,974 | $137,042 |
| 2019 | $2,104 | $199,036 | $64,681 | $134,355 |
| 2018 | $2,077 | $195,134 | $63,413 | $131,721 |
| 2017 | $2,037 | $191,309 | $62,170 | $129,139 |
| 2016 | $1,920 | $187,558 | $60,951 | $126,607 |
| 2015 | $1,891 | $184,742 | $60,036 | $124,706 |
| 2014 | $1,819 | $181,124 | $58,860 | $122,264 |
Source: Public Records
Map
Nearby Homes
- 875 Camino Caballo
- 219 Lema Dr
- 217 Hope Way
- 228 Chaparral Ln
- 1010 1012 Upper Los Berros Rd
- 255 Encino Ln
- 759 Viola Ct
- 620 Camino Roble
- 615 Sweet Donna Place
- 719 W Tefft St
- 680 Hill St
- Mesa Plan at Hill Street Terraces - Hill Street Series
- Pacific Plan at Hill Street Terraces - Hill Street Series
- Monarch Plan at Hill Street Terraces - Hill Street Series
- Rancho Plan at Hill Street Terraces - Hill Street Series
- Dana Plan at Hill Street Terraces - Hill Street Series
- 160 San Antonio Ln
- 232 Scarlett Cir
- 449 W Tefft St Unit 23
- 449 W Tefft St Unit 13