
Seller's Agent in 2023
Kim San Jule
Real Brokerage Technologies
(805) 345-8303
4 in this area
67 Total Sales
Estimated Value: $933,000 - $1,110,000
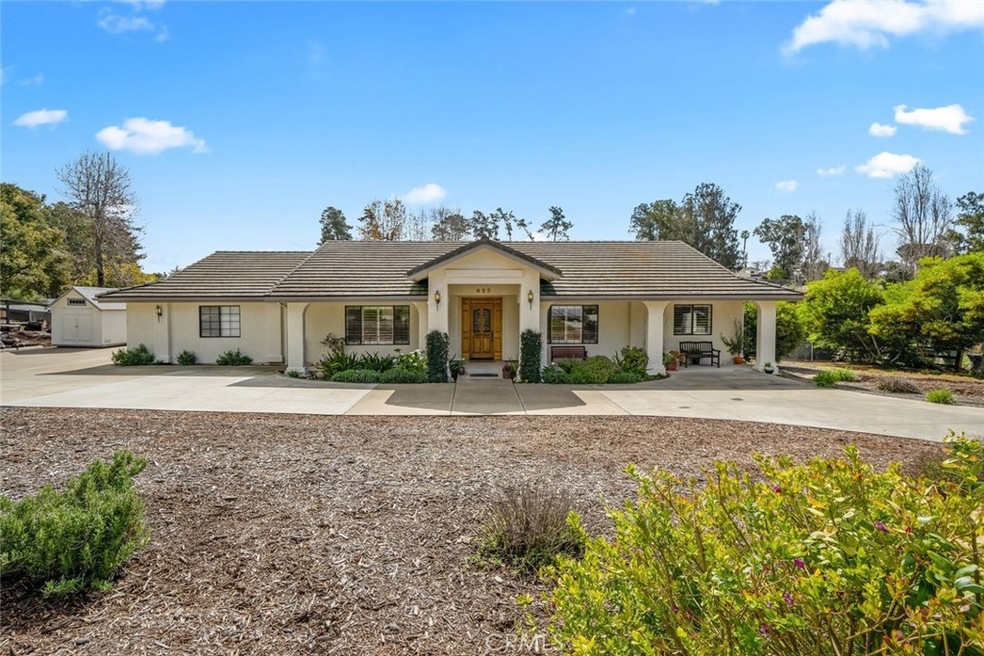
Beautiful single-level home on nearly an acre lot located on a cul-de-sac street in a highly desirable neighborhood. Bright, airy, and immaculate, this home is well-maintained and move-in ready! Wonderful open floor plan with vaulted ceilings and luxury plank flooring and shutters throughout. The cheerful kitchen boasts solid-surface countertops and a sunny breakfast nook leading to a spacious laundry room. Enjoy the California lifestyle year-round - entertain guests on a large composite deck or enjoy gardening activities or 4-H projects in a huge, fenced backyard with raised beds/garden area and several mature fruit trees. Additional features include an owned solar system and two storage sheds. Fantastic curb appeal with generous circular concrete driveway and appealing side entry, two-car garage - plenty of room for RV and toys! Conveniently located near Nipomo Regional Park, shopping, and restaurants.
Last Agent to Sell the Property
Real Brokerage Technologies License #01948144 Listed on: 03/24/2023
We collect this data history from publicly available records. To have your information removed, we recommend requesting removal directly through your county’s website.
We collect this data history from publicly available records. To have your information removed, we recommend requesting removal directly through your county’s website.
| Date | Buyer | Sale Price | Title Company |
|---|---|---|---|
| $950,000 | First American Title | ||
| -- | None Listed On Document | ||
| $649,000 | First American Title Company |
We collect this data history from publicly available records. To have your information removed, we recommend requesting removal directly through your county’s website.
| Date | Status | Borrower | Loan Amount |
|---|---|---|---|
| Open | $250,000 | ||
| Previous Owner | $519,200 |
We collect this data history from publicly available records. To have your information removed, we recommend requesting removal directly through your county’s website.
| Date | Event | Price | List to Sale | Price per Sq Ft | Prior Sale |
|---|---|---|---|---|---|
| 05/03/2023 05/03/23 | Sold | $950,000 | -0.4% | $524 / Sq Ft | |
| 03/30/2023 03/30/23 | Pending | -- | -- | -- | |
| 03/24/2023 03/24/23 | For Sale | $954,000 | +47.0% | $526 / Sq Ft | |
| 09/09/2016 09/09/16 | Sold | $649,000 | -- | $358 / Sq Ft | View Prior Sale |
We collect this data history from publicly available records. To have your information removed, we recommend requesting removal directly through your county’s website.
| Year | Tax Paid | Tax Assessment Tax Assessment Total Assessment is a certain percentage of the fair market value that is determined by local assessors to be the total taxable value of land and additions on the property. | Land | Improvement |
|---|---|---|---|---|
| 2025 | $10,166 | $988,380 | $546,210 | $442,170 |
| 2024 | $7,585 | $969,000 | $535,500 | $433,500 |
| 2023 | $7,585 | $723,966 | $390,429 | $333,537 |
| 2022 | $7,469 | $709,772 | $382,774 | $326,998 |
| 2021 | $7,454 | $695,856 | $375,269 | $320,587 |
| 2020 | $7,368 | $688,722 | $371,422 | $317,300 |
| 2019 | $7,321 | $675,219 | $364,140 | $311,079 |
| 2018 | $7,232 | $661,980 | $357,000 | $304,980 |
| 2017 | $7,095 | $649,000 | $350,000 | $299,000 |
| 2016 | $4,704 | $449,458 | $251,393 | $198,065 |
| 2015 | $4,636 | $442,707 | $247,617 | $195,090 |
| 2014 | $4,462 | $434,036 | $242,767 | $191,269 |
Seller's Agent in 2023
Kim San Jule
Real Brokerage Technologies
(805) 345-8303
4 in this area
67 Total Sales
Buyer's Agent in 2023
Jennifer Harris
RE/MAX
(805) 610-2420
1 in this area
13 Total Sales
J
Seller's Agent in 2016
Jessie Madril
Taylor Hoving Realty Group
C
Buyer's Agent in 2016
Carolyn Wendt
San Luis Obispo Realty
Source: California Regional Multiple Listing Service (CRMLS)
MLS Number: PI23048930
APN: 091-327-008
Disclaimer: Certain information contained herein is derived from information provided by parties other than Homes.com. All information provided is deemed reliable, but is not guaranteed to be accurate and should be independently verified.
![]() The multiple listing data appearing on this website, or contained in reports produced therefrom, is owned and copyrighted by California Regional Multiple Listing Service, Inc. ("CRMLS") and is protected by all applicable copyright laws. Information provided is for viewer's personal, non-commercial use and may not be used for any purpose other than to identify prospective properties the viewer may be interested in purchasing. All listing data, including but not limited to square footage and lot size is believed to be accurate, but the listing Agent, listing Broker and CRMLS and its affiliates do not warrant or guarantee such accuracy. The viewer should independently verify the listed data prior to making any decisions based on such information by personal inspection and/or contacting a real estate professional.
The multiple listing data appearing on this website, or contained in reports produced therefrom, is owned and copyrighted by California Regional Multiple Listing Service, Inc. ("CRMLS") and is protected by all applicable copyright laws. Information provided is for viewer's personal, non-commercial use and may not be used for any purpose other than to identify prospective properties the viewer may be interested in purchasing. All listing data, including but not limited to square footage and lot size is believed to be accurate, but the listing Agent, listing Broker and CRMLS and its affiliates do not warrant or guarantee such accuracy. The viewer should independently verify the listed data prior to making any decisions based on such information by personal inspection and/or contacting a real estate professional.
Based on information from California Regional Multiple Listing Service, Inc. and /or other sources. All data, including all measurements and calculations of area, is obtained from various sources and has not been, and will not be, verified by broker or MLS. All information should be independently reviewed and verified for accuracy. Properties may or may not be listed by the office/agent presenting the information
Ask me questions while you tour the home.