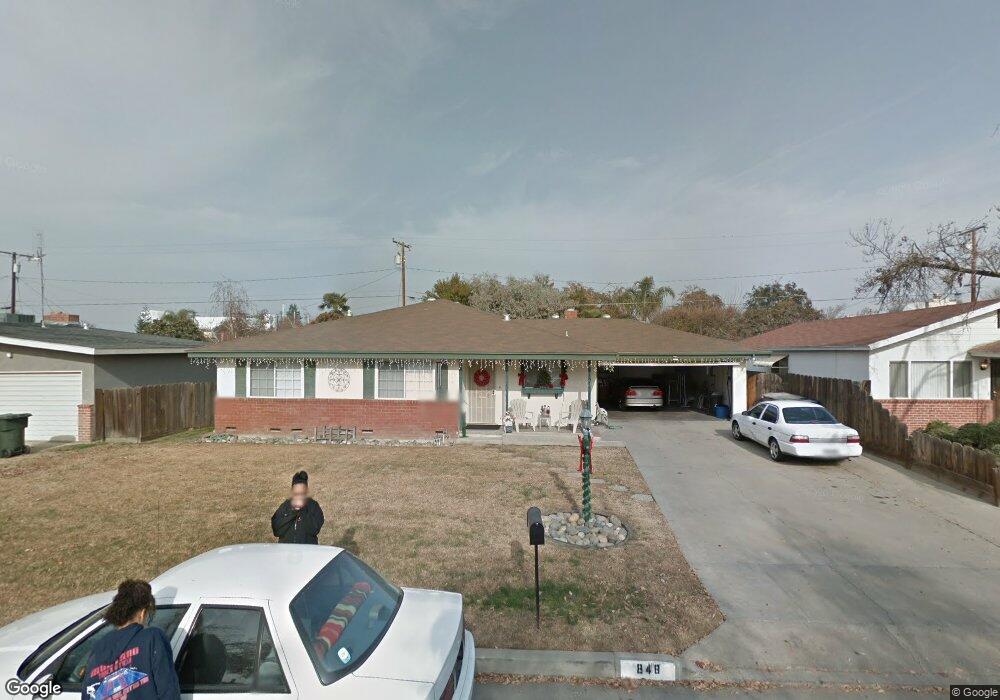
848 E Lyndale Ave Tulare, CA 93274
Northeast Tulare NeighborhoodEstimated Value: $316,518 - $339,000
3
Beds
2
Baths
1,532
Sq Ft
$212/Sq Ft
Est. Value
About This Home
This home is located at 848 E Lyndale Ave, Tulare, CA 93274 and is currently estimated at $324,880, approximately $212 per square foot. 848 E Lyndale Ave is a home located in Tulare County with nearby schools including Garden Elementary School, Cherry Avenue Middle School, and Tulare Western High School.
Ownership History
Date
Name
Owned For
Owner Type
Purchase Details
Closed on
Jan 18, 2023
Sold by
Torrence Kathy
Bought by
Studer Kathy
Current Estimated Value
Purchase Details
Closed on
May 21, 2001
Sold by
Torrence Kathy
Bought by
Torrence Kathy
Home Financials for this Owner
Home Financials are based on the most recent Mortgage that was taken out on this home.
Original Mortgage
$69,100
Interest Rate
7.06%
Purchase Details
Closed on
May 12, 2000
Sold by
Pinheiro Henry C
Bought by
Torrence Kathy
Home Financials for this Owner
Home Financials are based on the most recent Mortgage that was taken out on this home.
Original Mortgage
$64,000
Interest Rate
8.18%
Purchase Details
Closed on
May 31, 1995
Sold by
Houck Robert I
Bought by
Pinheiro Henry C and Pinheiro Mary Jane
Home Financials for this Owner
Home Financials are based on the most recent Mortgage that was taken out on this home.
Original Mortgage
$66,585
Interest Rate
7.92%
Mortgage Type
FHA
Create a Home Valuation Report for This Property
The Home Valuation Report is an in-depth analysis detailing your home's value as well as a comparison with similar homes in the area
Home Values in the Area
Average Home Value in this Area
Purchase History
| Date | Buyer | Sale Price | Title Company |
|---|---|---|---|
| Studer Kathy | -- | -- | |
| Torrence Kathy | -- | First American Title Co | |
| Torrence Kathy | $109,000 | Fidelity National Title Co | |
| Torrence Kathy | -- | Fidelity National Title Co | |
| Pinheiro Henry C | $66,500 | Old Republic Title Company |
Source: Public Records
Mortgage History
| Date | Status | Borrower | Loan Amount |
|---|---|---|---|
| Previous Owner | Torrence Kathy | $69,100 | |
| Previous Owner | Torrence Kathy | $64,000 | |
| Previous Owner | Pinheiro Henry C | $66,585 |
Source: Public Records
Tax History
| Year | Tax Paid | Tax Assessment Tax Assessment Total Assessment is a certain percentage of the fair market value that is determined by local assessors to be the total taxable value of land and additions on the property. | Land | Improvement |
|---|---|---|---|---|
| 2025 | $1,746 | $167,539 | $46,112 | $121,427 |
| 2024 | $1,746 | $164,255 | $45,208 | $119,047 |
| 2023 | $1,700 | $161,035 | $44,322 | $116,713 |
| 2022 | $1,649 | $157,878 | $43,453 | $114,425 |
| 2021 | $1,626 | $154,782 | $42,601 | $112,181 |
| 2020 | $1,653 | $153,195 | $42,164 | $111,031 |
| 2019 | $1,693 | $150,191 | $41,337 | $108,854 |
| 2018 | $1,664 | $147,246 | $40,526 | $106,720 |
| 2017 | $1,647 | $144,358 | $39,731 | $104,627 |
| 2016 | $1,573 | $141,527 | $38,952 | $102,575 |
| 2015 | $1,517 | $139,401 | $38,367 | $101,034 |
| 2014 | $1,517 | $136,670 | $37,615 | $99,055 |
Source: Public Records
Map
Nearby Homes
- 855 E Pleasant Ave
- 648 Auburn St
- 1142 N Gem St
- 320 N Blackstone St Unit 14
- 1113 N Manor Dr
- 1072 E Sycamore Ave
- 861 E Sycamore Ave
- 815 E Sycamore Ave
- 273 E Gannon Dr
- 1145 N M St
- 149 S Salida Place
- 908 N Beatrice Dr
- 1582 E Ben Franklin Ave
- 1352 N M St
- 130 E Woodward Dr
- 1563 E Glenwood Ave
- 1128 N Jefferson St
- 1611 E Burton Ave
- 202 N L St
- 1741 Vineland Ave
- 856 E Lyndale Ave
- 846 E Lyndale Ave
- 856 E Lyndale Dr
- 832 E Lyndale Dr
- 847 E Pleasant Ave
- 864 E Lyndale Ave
- 832 E Lyndale Ave
- 839 E Pleasant Ave
- 849 E Lyndale Ave
- 857 E Lyndale Ave
- 841 E Lyndale Ave
- 863 E Pleasant Ave
- 865 E Lyndale Ave
- 833 E Pleasant Ave
- 656 N Cherry St
- 876 E Lyndale Ave
- 833 E Lyndale Ave
- 820 E Lyndale Dr
- 873 E Lyndale Ave
- 820 E Lyndale Ave
Your Personal Tour Guide
Ask me questions while you tour the home.