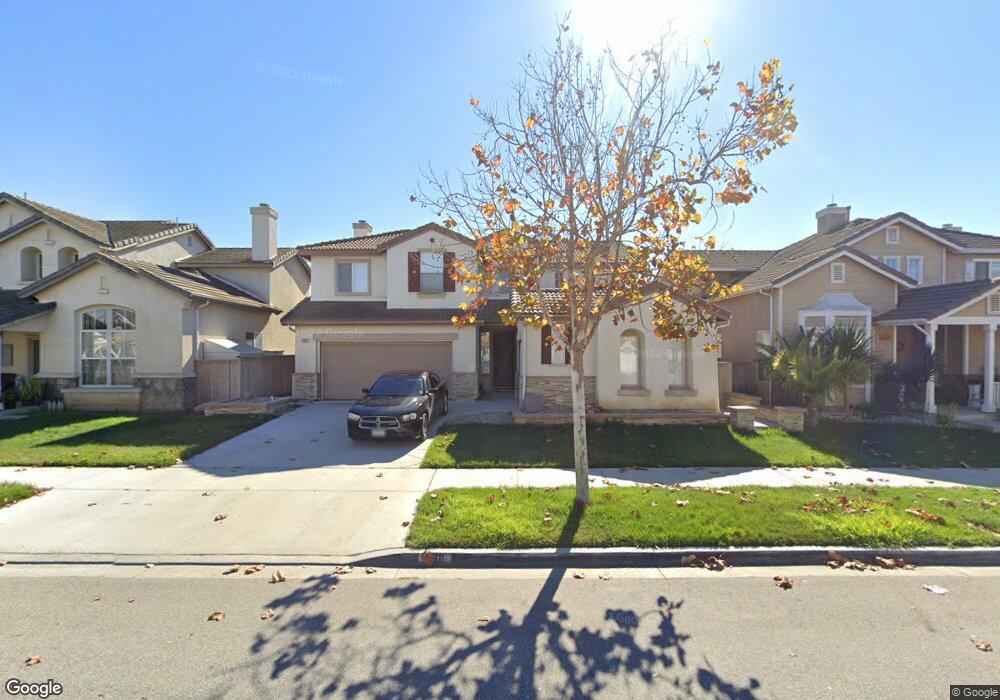
848 Navito Way Oxnard, CA 93030
West Village NeighborhoodEstimated Value: $905,000 - $978,000
5
Beds
3
Baths
2,427
Sq Ft
$384/Sq Ft
Est. Value
About This Home
This home is located at 848 Navito Way, Oxnard, CA 93030 and is currently estimated at $930,961, approximately $383 per square foot. 848 Navito Way is a home located in Ventura County with nearby schools including Brekke Elementary School, R.J. Frank Academy of Marine Science & Engineering, and Pacifica High School.
Ownership History
Date
Name
Owned For
Owner Type
Purchase Details
Closed on
May 13, 2015
Sold by
Mateo Esther C
Bought by
Mateo Esther C
Current Estimated Value
Purchase Details
Closed on
Apr 3, 2015
Sold by
Ambriz Danny Cordova and Ambriz Jovani Cordova
Bought by
Mateo Esther C
Purchase Details
Closed on
Mar 22, 2011
Sold by
Ambriz Danny Cordova and Mateo Jovani Cordova
Bought by
Ambriz Danny Cordova and Ambriz Jovani Cordova
Purchase Details
Closed on
Sep 4, 2009
Sold by
Mateo Esther C
Bought by
Mateo Jovani Cordova and Ambriz Danny Cordova
Purchase Details
Closed on
Aug 24, 2009
Sold by
Mateo Juan and Mateo Esther C
Bought by
Mateo Esther C
Purchase Details
Closed on
Sep 28, 2000
Sold by
Wl Homes Llc
Bought by
Mateo Juan and Mateo Esther
Home Financials for this Owner
Home Financials are based on the most recent Mortgage that was taken out on this home.
Original Mortgage
$231,192
Interest Rate
7.81%
Create a Home Valuation Report for This Property
The Home Valuation Report is an in-depth analysis detailing your home's value as well as a comparison with similar homes in the area
Home Values in the Area
Average Home Value in this Area
Purchase History
| Date | Buyer | Sale Price | Title Company |
|---|---|---|---|
| Mateo Esther C | -- | None Available | |
| Mateo Esther C | -- | None Available | |
| Ambriz Danny Cordova | -- | None Available | |
| Mateo Jovani Cordova | -- | None Available | |
| Mateo Esther C | -- | None Available | |
| Mateo Juan | $289,000 | Fidelity National Title Co |
Source: Public Records
Mortgage History
| Date | Status | Borrower | Loan Amount |
|---|---|---|---|
| Previous Owner | Mateo Juan | $231,192 |
Source: Public Records
Tax History
| Year | Tax Paid | Tax Assessment Tax Assessment Total Assessment is a certain percentage of the fair market value that is determined by local assessors to be the total taxable value of land and additions on the property. | Land | Improvement |
|---|---|---|---|---|
| 2025 | $6,290 | $435,434 | $174,173 | $261,261 |
| 2024 | $6,290 | $426,897 | $170,758 | $256,139 |
| 2023 | $5,179 | $418,527 | $167,410 | $251,117 |
| 2022 | $5,209 | $410,321 | $164,127 | $246,194 |
| 2021 | $5,383 | $402,276 | $160,909 | $241,367 |
| 2020 | $5,260 | $398,153 | $159,260 | $238,893 |
| 2019 | $5,130 | $390,347 | $156,138 | $234,209 |
| 2018 | $4,806 | $382,694 | $153,077 | $229,617 |
| 2017 | $4,470 | $375,191 | $150,076 | $225,115 |
| 2016 | $4,706 | $367,835 | $147,134 | $220,701 |
| 2015 | $5,128 | $362,312 | $144,925 | $217,387 |
| 2014 | $5,079 | $355,217 | $142,087 | $213,130 |
Source: Public Records
Map
Nearby Homes
- 565 Rosalinda Dr
- 1623 Lola Way
- 255 Douglas Ave
- 246 Doris Ave
- 411 Eastwood Dr
- 136 S Roosevelt Ave
- 403 E 2nd St
- 1902 Ribera Dr Unit 86
- 800 S A St
- 1930 Ribera Dr
- 2016 Blackberry Cir
- 2005 Blackberry Cir
- 2041 Blackberry Cir
- 715 W Robert Ave
- 209 Lafayette Dr
- 722 W Robert Ave
- 425 W 1st St
- 620 W Gonzales Rd
- 620 W Gonzales Rd Unit B
- 620 W Gonzales Rd Unit C
- 858 Navito Way
- 838 Navito Way
- 847 Morado Place
- 857 Morado Place
- 837 Morado Place
- 908 Navito Way
- 828 Navito Way
- 827 Morado Place
- 907 Morado Place
- 849 Navito Way
- 839 Navito Way
- 859 Navito Way
- 818 Navito Way
- 918 Navito Way
- 817 Morado Place
- 917 Morado Place
- 829 Navito Way
- 909 Navito Way
- 808 Navito Way
- 819 Navito Way
Your Personal Tour Guide
Ask me questions while you tour the home.