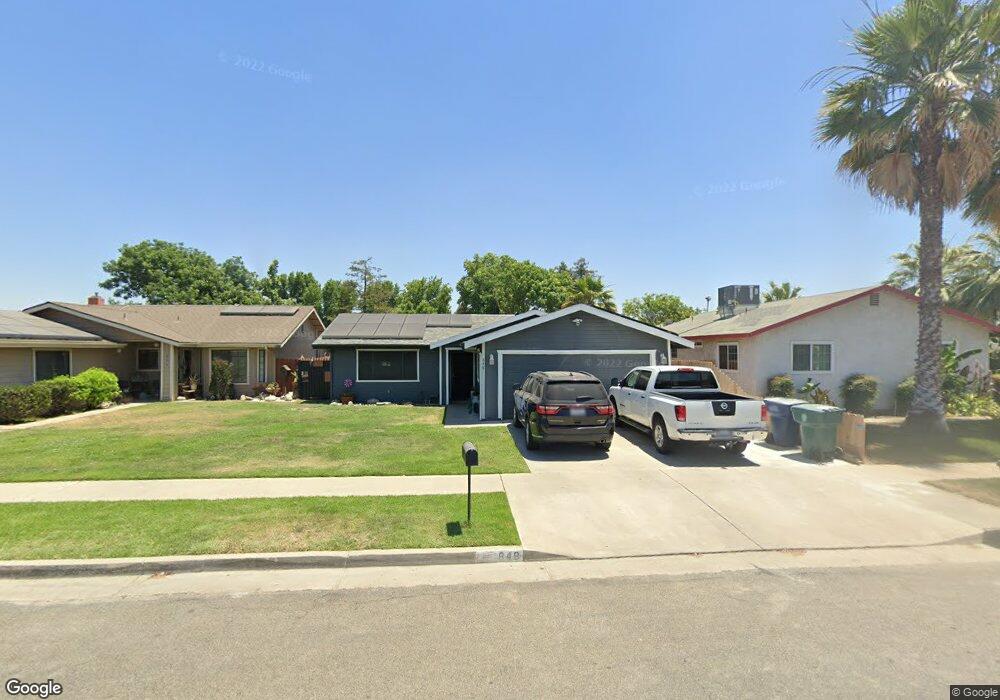
848 S U St Tulare, CA 93274
Tulare Southeast NeighborhoodEstimated Value: $291,000 - $339,517
3
Beds
3
Baths
1,248
Sq Ft
$247/Sq Ft
Est. Value
About This Home
This home is located at 848 S U St, Tulare, CA 93274 and is currently estimated at $307,879, approximately $246 per square foot. 848 S U St is a home located in Tulare County with nearby schools including Lincoln Elementary School, Cherry Avenue Middle School, and Tulare Union High School.
Ownership History
Date
Name
Owned For
Owner Type
Purchase Details
Closed on
Dec 11, 2023
Sold by
Sigala Michael A
Bought by
Michael A Sigala Living Trust and Sigala
Current Estimated Value
Purchase Details
Closed on
Aug 6, 2022
Sold by
Sigala Michael A and Sigala Angela
Bought by
Sigala Michael A and Sigala Angela
Purchase Details
Closed on
Sep 23, 2021
Sold by
Saenz Rachel
Bought by
Sigala Michael A and Sigala Angela
Home Financials for this Owner
Home Financials are based on the most recent Mortgage that was taken out on this home.
Original Mortgage
$200,000
Interest Rate
2.8%
Mortgage Type
New Conventional
Purchase Details
Closed on
Feb 23, 2006
Sold by
Saenz Rachel
Bought by
Saenz Rachel
Purchase Details
Closed on
Nov 16, 2004
Sold by
Mora Ramona B
Bought by
Mora Ramona
Purchase Details
Closed on
Sep 11, 2003
Sold by
Mora Ramona B
Bought by
Mora Ramona
Home Financials for this Owner
Home Financials are based on the most recent Mortgage that was taken out on this home.
Original Mortgage
$50,000
Interest Rate
6.3%
Mortgage Type
Purchase Money Mortgage
Purchase Details
Closed on
Apr 7, 2000
Sold by
Mora Ramona
Bought by
Mora Ramona
Create a Home Valuation Report for This Property
The Home Valuation Report is an in-depth analysis detailing your home's value as well as a comparison with similar homes in the area
Home Values in the Area
Average Home Value in this Area
Purchase History
| Date | Buyer | Sale Price | Title Company |
|---|---|---|---|
| Michael A Sigala Living Trust | -- | None Listed On Document | |
| Sigala Michael A | -- | None Listed On Document | |
| Sigala Michael A | -- | Stewart Title Of Ca Inc | |
| Saenz Rachel | -- | None Available | |
| Mora Ramona | -- | -- | |
| Mora Ramona | -- | Financial Title Company | |
| Mora Ramona | -- | Financial Title Company | |
| Mora Ramona | -- | -- |
Source: Public Records
Mortgage History
| Date | Status | Borrower | Loan Amount |
|---|---|---|---|
| Previous Owner | Sigala Michael A | $200,000 | |
| Previous Owner | Mora Ramona | $50,000 |
Source: Public Records
Tax History
| Year | Tax Paid | Tax Assessment Tax Assessment Total Assessment is a certain percentage of the fair market value that is determined by local assessors to be the total taxable value of land and additions on the property. | Land | Improvement |
|---|---|---|---|---|
| 2025 | $3,454 | $317,322 | $52,020 | $265,302 |
| 2024 | $3,454 | $90,168 | $4,328 | $85,840 |
| 2023 | $976 | $88,401 | $4,244 | $84,157 |
| 2022 | $674 | $61,668 | $4,161 | $57,507 |
| 2021 | $665 | $60,458 | $4,079 | $56,379 |
| 2020 | $676 | $59,838 | $4,037 | $55,801 |
| 2019 | $693 | $58,665 | $3,958 | $54,707 |
| 2018 | $682 | $57,514 | $3,880 | $53,634 |
| 2017 | $676 | $56,386 | $3,804 | $52,582 |
| 2016 | $646 | $55,280 | $3,729 | $51,551 |
| 2015 | $625 | $54,450 | $3,673 | $50,777 |
| 2014 | $625 | $53,383 | $3,601 | $49,782 |
Source: Public Records
Map
Nearby Homes
- 840 E Bardsley Ave
- 980 S Spruce St
- 736 S Spruce St
- 1214 S Spruce St
- 0 Spruce St S Unit 239148
- 0 Spruce St S Unit 233400
- 1483 E Bardsley Ave
- 1316 S Spruce St
- 1533 Etna Dr
- 1453 E Sonora Ave
- 2973 Riviera Ave
- 501 S Magnolia St
- 1502 S Lydia Dr
- 620 Mariposa Ave
- 1 Spruce St
- 149 S Salida Place
- 421 S Laspina St
- 1625 S Lydia Dr
- 931 S Amber St
- 861 E Sycamore Ave
Your Personal Tour Guide
Ask me questions while you tour the home.