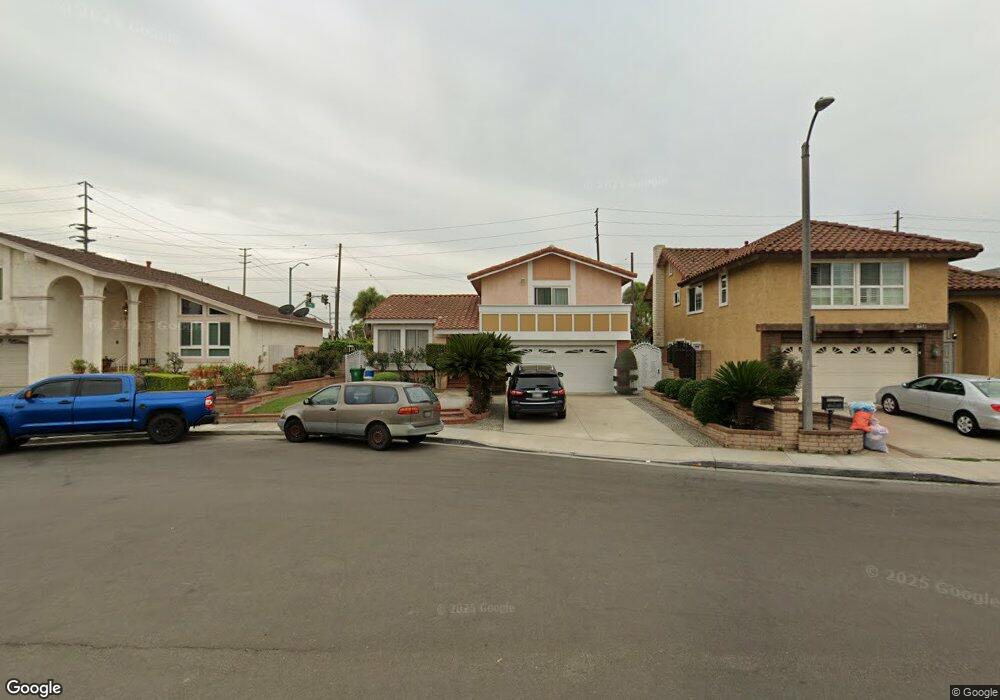
8482 Torchwood Cir Westminster, CA 92683
Star View NeighborhoodEstimated Value: $1,213,000 - $1,416,000
4
Beds
3
Baths
2,281
Sq Ft
$576/Sq Ft
Est. Value
About This Home
This home is located at 8482 Torchwood Cir, Westminster, CA 92683 and is currently estimated at $1,314,121, approximately $576 per square foot. 8482 Torchwood Cir is a home located in Orange County with nearby schools including Demille Elementary, Warner Middle, and Westminster High School.
Ownership History
Date
Name
Owned For
Owner Type
Purchase Details
Closed on
Nov 28, 2001
Sold by
Le Minh T and Pham Cu
Bought by
Lam James and Le Minh T
Current Estimated Value
Home Financials for this Owner
Home Financials are based on the most recent Mortgage that was taken out on this home.
Original Mortgage
$260,000
Interest Rate
6.67%
Purchase Details
Closed on
Nov 19, 1996
Sold by
Lam James
Bought by
Le Minh Thi
Home Financials for this Owner
Home Financials are based on the most recent Mortgage that was taken out on this home.
Original Mortgage
$204,000
Interest Rate
7.88%
Purchase Details
Closed on
Oct 16, 1996
Sold by
Tuoc Trinh and Chau Trinh Chau
Bought by
Le Minh Thi and Pham Cu
Home Financials for this Owner
Home Financials are based on the most recent Mortgage that was taken out on this home.
Original Mortgage
$204,000
Interest Rate
7.88%
Create a Home Valuation Report for This Property
The Home Valuation Report is an in-depth analysis detailing your home's value as well as a comparison with similar homes in the area
Home Values in the Area
Average Home Value in this Area
Purchase History
| Date | Buyer | Sale Price | Title Company |
|---|---|---|---|
| Lam James | -- | Southland Title Corporation | |
| Le Minh Thi | -- | Fidelity National Title Ins | |
| Le Minh Thi | $230,000 | Fidelity National Title Ins |
Source: Public Records
Mortgage History
| Date | Status | Borrower | Loan Amount |
|---|---|---|---|
| Closed | Lam James | $260,000 | |
| Closed | Le Minh Thi | $204,000 |
Source: Public Records
Tax History Compared to Growth
Tax History
| Year | Tax Paid | Tax Assessment Tax Assessment Total Assessment is a certain percentage of the fair market value that is determined by local assessors to be the total taxable value of land and additions on the property. | Land | Improvement |
|---|---|---|---|---|
| 2025 | $5,760 | $471,833 | $254,109 | $217,724 |
| 2024 | $5,760 | $462,582 | $249,127 | $213,455 |
| 2023 | $5,565 | $453,512 | $244,242 | $209,270 |
| 2022 | $5,553 | $444,620 | $239,453 | $205,167 |
| 2021 | $5,417 | $435,902 | $234,757 | $201,145 |
| 2020 | $5,354 | $431,433 | $232,350 | $199,083 |
| 2019 | $5,296 | $422,974 | $227,794 | $195,180 |
| 2018 | $5,296 | $414,681 | $223,328 | $191,353 |
| 2017 | $5,101 | $406,550 | $218,949 | $187,601 |
| 2016 | $4,945 | $398,579 | $214,656 | $183,923 |
| 2015 | $4,863 | $392,592 | $211,431 | $181,161 |
| 2014 | $4,757 | $384,902 | $207,289 | $177,613 |
Source: Public Records
Map
Nearby Homes
- 8331 Gumwood Cir
- 8206 Maureen Dr Unit 16
- 8200 Bosa Ave Unit 92
- 8200 Bolsa Ave Unit 2
- 8200 Bolsa Ave Unit 42
- 8200 Bolsa Ave Spc#146
- 8822 Palos Verdes Ave
- 15081 Van Buren St
- 8961 Emerald Ave
- 15300 Magnolia St Unit 71
- 15621 Beach Blvd Unit 74
- 15621 Beach Blvd Unit 108
- 15621 Beach Blvd Unit 28
- 15621 Beach Blvd
- 15621 Beach Blvd Unit 115
- 15621 Beach Blvd Unit 23
- 15621 Beach Blvd Unit 19
- 15141 Beach Blvd Unit 39
- 15141 Beach Blvd Unit 44
- 14972 Beach Blvd
- 8472 Torchwood Cir
- 8492 Torchwood Cir
- 8462 Torchwood Cir
- 8452 Torchwood Cir
- 8491 Torchwood Cir
- 8481 Torchwood Cir
- 8471 Torchwood Cir
- 8461 Torchwood Cir
- 8442 Torchwood Cir
- 15512 Sandusky Ln
- 8451 Torchwood Cir
- 15461 Balboa St
- 8432 Torchwood Cir
- 8522 Thorpe Ave
- 8441 Torchwood Cir
- 15522 Sandusky Ln
- 8482 Pepperwood Cir
- 8472 Pepperwood Cir
- 15451 Balboa St
- 8492 Pepperwood Cir