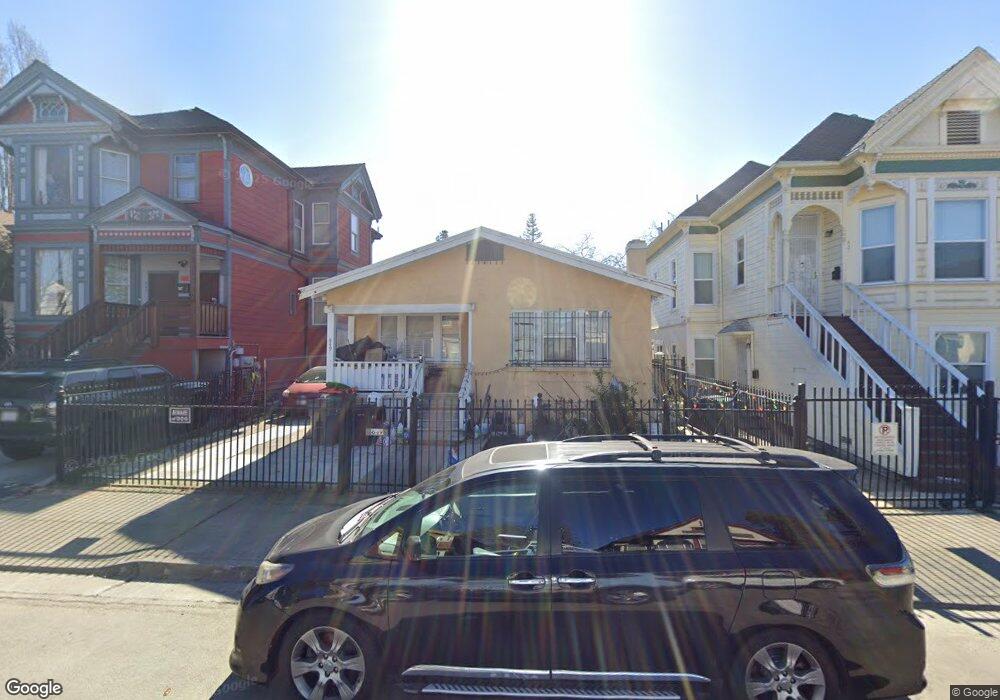
849 19th St Oakland, CA 94607
West Oakland NeighborhoodEstimated Value: $624,000 - $697,000
3
Beds
2
Baths
1,323
Sq Ft
$504/Sq Ft
Est. Value
About This Home
This home is located at 849 19th St, Oakland, CA 94607 and is currently estimated at $666,252, approximately $503 per square foot. 849 19th St is a home located in Alameda County with nearby schools including M. L. King Jr. Elementary School, West Oakland Middle School, and McClymonds High School.
Ownership History
Date
Name
Owned For
Owner Type
Purchase Details
Closed on
Jan 26, 2022
Sold by
Betty P H Lim 2019 Living Trust
Bought by
Kwok William and Lim Betty
Current Estimated Value
Purchase Details
Closed on
Jun 3, 2010
Sold by
Wells Fargo Bank Na
Bought by
Mui Yit F and Li Fengfeng
Home Financials for this Owner
Home Financials are based on the most recent Mortgage that was taken out on this home.
Original Mortgage
$100,000
Interest Rate
4.79%
Mortgage Type
New Conventional
Purchase Details
Closed on
May 5, 2010
Sold by
Harrison Yvonne and The Mary R Harrison Revocable
Bought by
Wells Fargo Bank Na and Wachovia Mortgage
Home Financials for this Owner
Home Financials are based on the most recent Mortgage that was taken out on this home.
Original Mortgage
$100,000
Interest Rate
4.79%
Mortgage Type
New Conventional
Purchase Details
Closed on
Jun 28, 2001
Sold by
Harrison Mary R
Bought by
Harrison Mary R and The Mary R Harrison Revocable
Purchase Details
Closed on
Oct 5, 1993
Sold by
Harrison Yvonne M
Bought by
Harrison Mary R
Create a Home Valuation Report for This Property
The Home Valuation Report is an in-depth analysis detailing your home's value as well as a comparison with similar homes in the area
Home Values in the Area
Average Home Value in this Area
Purchase History
| Date | Buyer | Sale Price | Title Company |
|---|---|---|---|
| Kwok William | -- | New Title Company Name | |
| Mui Yit F | $145,000 | Fidelity National Title Co | |
| Wells Fargo Bank Na | $176,968 | Accommodation | |
| Harrison Mary R | -- | -- | |
| Harrison Mary R | -- | -- |
Source: Public Records
Mortgage History
| Date | Status | Borrower | Loan Amount |
|---|---|---|---|
| Previous Owner | Mui Yit F | $100,000 |
Source: Public Records
Tax History Compared to Growth
Tax History
| Year | Tax Paid | Tax Assessment Tax Assessment Total Assessment is a certain percentage of the fair market value that is determined by local assessors to be the total taxable value of land and additions on the property. | Land | Improvement |
|---|---|---|---|---|
| 2025 | $4,144 | $185,758 | $55,727 | $130,031 |
| 2024 | $4,144 | $182,117 | $54,635 | $127,482 |
| 2023 | $4,248 | $178,548 | $53,564 | $124,984 |
| 2022 | $4,078 | $175,047 | $52,514 | $122,533 |
| 2021 | $3,774 | $171,615 | $51,484 | $120,131 |
| 2020 | $3,731 | $169,857 | $50,957 | $118,900 |
| 2019 | $3,513 | $166,527 | $49,958 | $116,569 |
| 2018 | $3,443 | $163,263 | $48,979 | $114,284 |
| 2017 | $3,283 | $160,063 | $48,019 | $112,044 |
| 2016 | $3,100 | $156,925 | $47,077 | $109,848 |
| 2015 | $3,080 | $154,570 | $46,371 | $108,199 |
| 2014 | $3,024 | $151,541 | $45,462 | $106,079 |
Source: Public Records
Map
Nearby Homes
- 1915 West St
- 881 21st St
- 2112 West St Unit 2
- 861 W Grand Ave
- 2103 Myrtle St
- 1424 Market St
- 850 W Grand Ave Unit 6
- 845 Isabella St
- 2311 San Pablo Ave
- 1069 16th St
- 878 Athens Ave
- 2327 San Pablo Ave
- 2621 Market St
- 1810 Adeline St
- 710 24th St
- 630 Thomas L Berkley Way Unit 102
- 1486 Adeline St
- 2521 San Pablo Ave
- 734 25th St
- 1511 Jefferson St Unit PH7