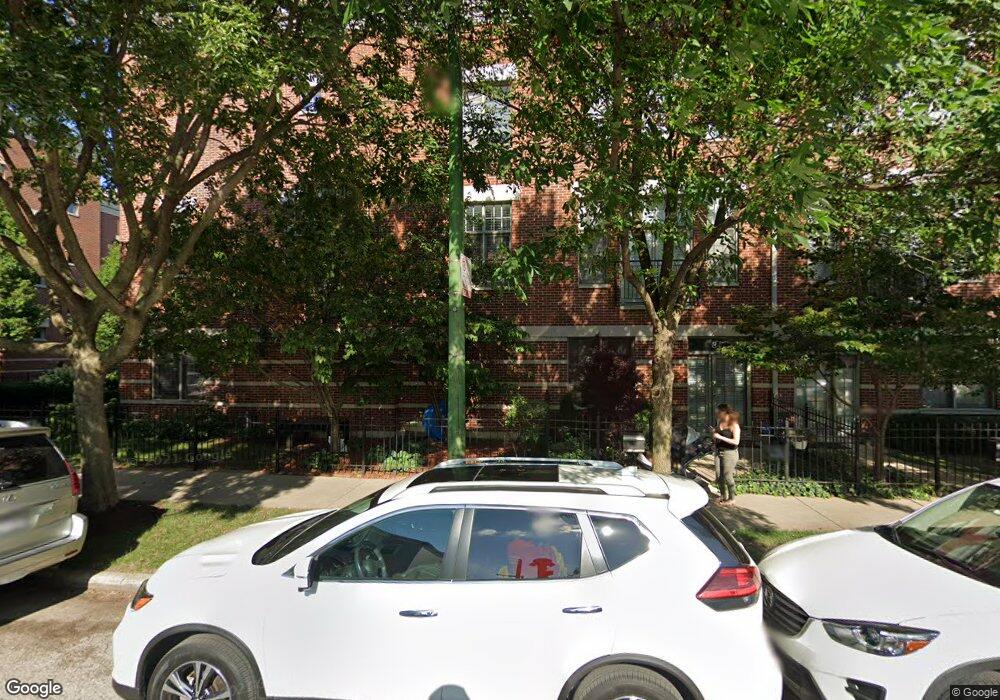
849 N May St Chicago, IL 60642
West Town NeighborhoodEstimated Value: $816,592 - $909,000
2
Beds
3
Baths
1,838
Sq Ft
$473/Sq Ft
Est. Value
About This Home
This home is located at 849 N May St, Chicago, IL 60642 and is currently estimated at $869,398, approximately $473 per square foot. 849 N May St is a home located in Cook County with nearby schools including Ogden Elementary School, Wells Community Academy High School, and Noble St Chtr-Noble Campus.
Ownership History
Date
Name
Owned For
Owner Type
Purchase Details
Closed on
Oct 21, 2021
Sold by
Landgren Diane M and The Diane M Langren 2001 Trust
Bought by
Schwartz Olivia
Current Estimated Value
Purchase Details
Closed on
Oct 5, 2014
Sold by
Zanger Raymond and Zanger Deborah
Bought by
Diane M Landgren 2001 Trust
Purchase Details
Closed on
May 31, 2006
Sold by
Chicago Title Land Trust Co
Bought by
Zanger Raymond and Zanger Deborah
Home Financials for this Owner
Home Financials are based on the most recent Mortgage that was taken out on this home.
Original Mortgage
$375,000
Interest Rate
6.68%
Mortgage Type
Fannie Mae Freddie Mac
Purchase Details
Closed on
Jul 27, 2002
Sold by
Greenley Peter
Bought by
Cole Taylor Bank and Trust #01-9011
Purchase Details
Closed on
May 10, 2001
Sold by
Greenley Peter A
Bought by
Cole Taylor Bank and Trust #01-9011
Create a Home Valuation Report for This Property
The Home Valuation Report is an in-depth analysis detailing your home's value as well as a comparison with similar homes in the area
Home Values in the Area
Average Home Value in this Area
Purchase History
| Date | Buyer | Sale Price | Title Company |
|---|---|---|---|
| Schwartz Olivia | $780,000 | None Available | |
| Diane M Landgren 2001 Trust | $530,000 | None Available | |
| Zanger Raymond | $553,000 | Pntn | |
| Cole Taylor Bank | -- | -- | |
| Cole Taylor Bank | -- | -- |
Source: Public Records
Mortgage History
| Date | Status | Borrower | Loan Amount |
|---|---|---|---|
| Previous Owner | Zanger Raymond | $375,000 |
Source: Public Records
Tax History Compared to Growth
Tax History
| Year | Tax Paid | Tax Assessment Tax Assessment Total Assessment is a certain percentage of the fair market value that is determined by local assessors to be the total taxable value of land and additions on the property. | Land | Improvement |
|---|---|---|---|---|
| 2024 | $13,544 | $66,000 | $9,119 | $56,881 |
| 2023 | $13,164 | $64,000 | $7,344 | $56,656 |
| 2022 | $13,164 | $64,000 | $7,344 | $56,656 |
| 2021 | $12,870 | $64,000 | $7,344 | $56,656 |
| 2020 | $11,916 | $53,491 | $4,161 | $49,330 |
| 2019 | $11,810 | $58,782 | $4,161 | $54,621 |
| 2018 | $11,611 | $58,782 | $4,161 | $54,621 |
| 2017 | $11,429 | $53,093 | $3,672 | $49,421 |
| 2016 | $10,634 | $53,093 | $3,672 | $49,421 |
| 2015 | $9,729 | $53,093 | $3,672 | $49,421 |
| 2014 | $7,764 | $44,415 | $3,060 | $41,355 |
| 2013 | $7,600 | $44,415 | $3,060 | $41,355 |
Source: Public Records
Map
Nearby Homes
- 919 N Willard Ct Unit 1N
- 950 W Huron St Unit 302
- 711 N Milwaukee Ave Unit 2
- 1203 W Superior St Unit 3C
- 650 N Morgan St Unit 504
- 636 N Racine Ave Unit 4S
- 685 N Peoria St Unit 1N
- 612 N Ogden Ave
- 613 N Ogden Ave Unit 2E
- 1322 W Huron St Unit 4N
- 602 N May St Unit 3
- 1356 W Walton St Unit 1E
- 1363 W Walton St
- 1340 W Chestnut St Unit 301
- 838 W Ancona St
- 658 N Green St
- 1303 W Ohio St
- 1448 W Chestnut St Unit 3
- 849 W Ohio St Unit 8
- 525 N Ada St Unit 43
- 849 N May St
- 849 N May St Unit K
- 849 N May St Unit H
- 849 N May St
- 849 N May St
- 849 N May St
- 849 N May St
- 849 N May St
- 849 N May St
- 849 N May St
- 849 N May St
- 849 N May St
- 849 N May St
- 849 N May St
- 849 N May St
- 849 N May St
- 849 N May St Unit E
- 849 N May St Unit M
- 849 N May St Unit J
- 849 N May St Unit B