8499 Simmons Rd Redding, CA 96001
Centerville NeighborhoodEstimated payment $21,041/month
About This Lot
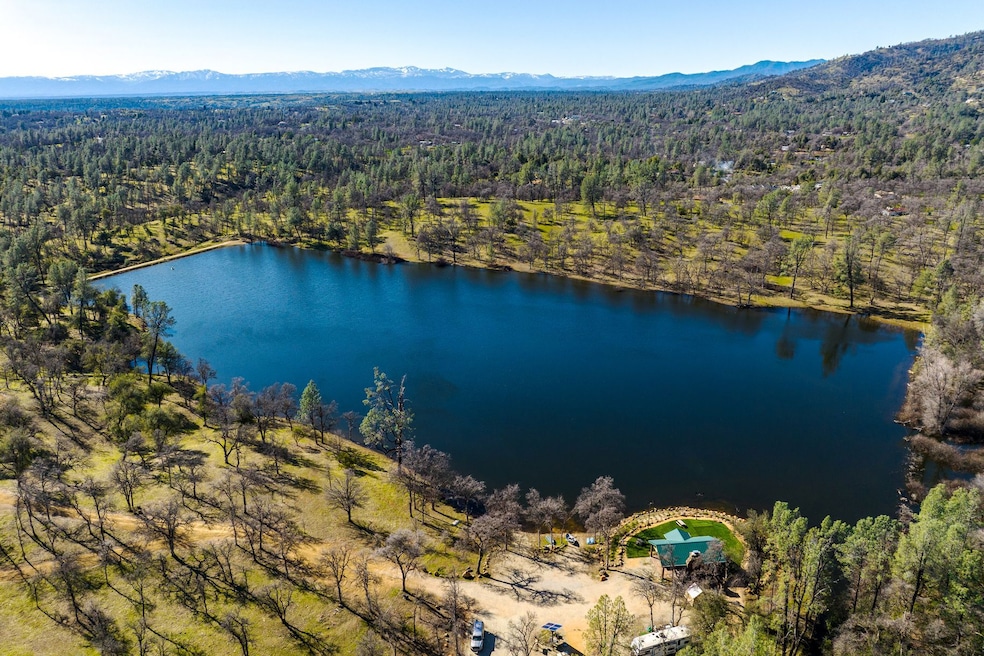
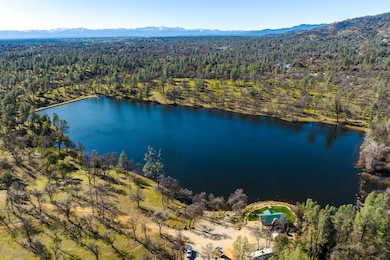
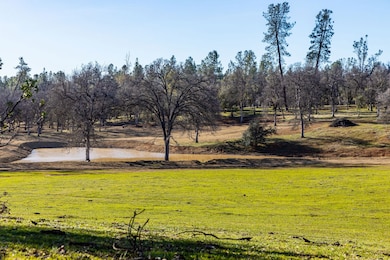
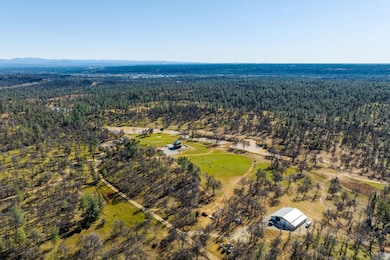
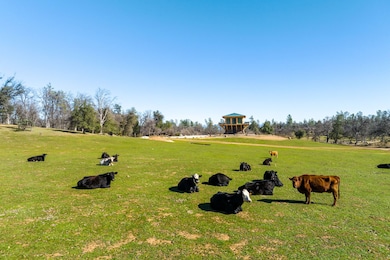
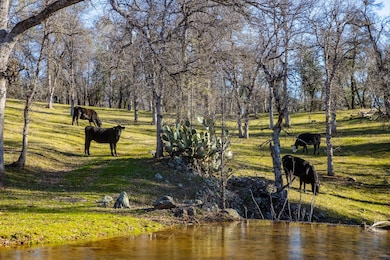
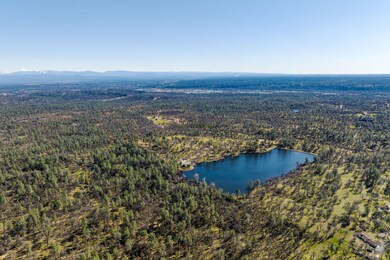
The 748 acre Reese Reservoir Ranch is very private yet located just minutes from downtown Redding, CA. The current owners have done a remarkable job clearing the property of brush and planting different grasses. The ranch currently runs cattle. There is a huge 25-acre lake that has great bass fishing and a beautifully designed covered pavilion with a stone fireplace, and a BBQ setup. Additional water attributes include two creeks, four wells, and numerous reservoirs. There is an impressive home recently built to replicate a forest service lookout tower. It has two bedrooms, a full bathroom, a kitchen, & a living room with incredible 360 views. The home was designed with beautiful wood and stone work throughout. There is also a large new shop building. This is an excellent recreational property for hunting, fishing, ATVing, and horseback riding. You can also capture majestic views of Mt. Lassen! This is a great opportunity to step into a well-maintained ranch with recreational and cattle attributes.
California Properties
Listed on: 06/18/2025

Property Details
Property Type
- Land
Est. Annual Taxes
- $21,197
Additional Features
- Current uses include hunting/fishing
- 2 Bedrooms
- Horses Allowed On Property
Map
Home Values in the Area
Average Home Value in this Area
Tax History
| Year | Tax Paid | Tax Assessment Tax Assessment Total Assessment is a certain percentage of the fair market value that is determined by local assessors to be the total taxable value of land and additions on the property. | Land | Improvement |
|---|---|---|---|---|
| 2025 | $21,197 | $1,988,382 | $1,274,096 | $714,286 |
| 2024 | $20,841 | $1,949,395 | $1,249,114 | $700,281 |
| 2023 | $20,841 | $1,911,172 | $1,224,622 | $686,550 |
| 2022 | $15,060 | $1,386,596 | $1,200,610 | $185,986 |
| 2021 | $13,321 | $1,225,769 | $1,177,069 | $48,700 |
| 2020 | $12,986 | $1,184,400 | $1,165,000 | $19,400 |
| 2019 | $1,517 | $134,316 | $124,747 | $9,569 |
| 2018 | $1,634 | $135,070 | $122,301 | $12,769 |
| 2017 | $1,502 | $132,529 | $119,903 | $12,626 |
| 2016 | $1,466 | $130,686 | $117,552 | $13,134 |
| 2015 | $1,451 | $129,485 | $115,787 | $13,698 |
| 2014 | $1,440 | $127,820 | $113,519 | $14,301 |
Property History
| Date | Event | Price | Change | Sq Ft Price |
|---|---|---|---|---|
| 06/18/2025 06/18/25 | For Sale | $3,490,000 | +7.4% | $3,878 / Sq Ft |
| 03/21/2025 03/21/25 | Price Changed | $3,250,000 | -6.9% | $3,611 / Sq Ft |
| 03/01/2024 03/01/24 | Price Changed | $3,490,000 | -8.2% | $3,878 / Sq Ft |
| 03/13/2023 03/13/23 | For Sale | $3,800,000 | +216.7% | $4,222 / Sq Ft |
| 08/09/2019 08/09/19 | Sold | $1,200,000 | -19.7% | $1,200 / Sq Ft |
| 07/10/2019 07/10/19 | Pending | -- | -- | -- |
| 06/26/2019 06/26/19 | For Sale | $1,495,000 | -- | $1,495 / Sq Ft |
Purchase History
| Date | Type | Sale Price | Title Company |
|---|---|---|---|
| Grant Deed | $1,200,000 | Placer Title Company | |
| Grant Deed | -- | None Available | |
| Interfamily Deed Transfer | -- | None Available | |
| Interfamily Deed Transfer | -- | -- |
- 4824 Aloe Vera Dr
- 000 Montgomery Ranch Rd
- 8928 Olney Park Dr
- 8940 Olney Park Dr
- 16160 Plateau Cir
- 16123 Plateau Cir
- 9109 Simmons Rd
- 0 Placer Rd
- 7780 Raven Rd
- 15745 Montgomery Ranch Rd
- Lot 1 Canto de Las Lupine
- 16300 Canto de Las Lupine Dr
- Lot 9 Canto de Las Lupine Dr
- 18.29Acres Canto de Las Lupine Dr
- 5.75 Acres Canto de Las Lupine Dr
- 5.77 Acres Canto de Las Lupine Dr
- 26.27Acres Canto de Las Lupine Dr
- 5.26 Acres Canto de Las Lupine Dr
- 4.36 Acres Canto de Las Lupine Dr
- 9200 Silver King Rd
- 2172 West St
- 3610 Scenic Dr
- 1340 Orange Ave Unit b
- 1559 Willis St
- 2142 Butte St
- 2045 Shasta St
- 1551 Market St
- 1300 Market St Unit 304
- 540 South St
- 2430 Lake Redding Dr
- 680 Saginaw St Unit 7 /2nd floor
- 3700 Churn Creek Rd
- 1046 Continental St Unit 4
- 1895 Benton Dr
- 1215 Industrial St
- 3934 Mercury Dr
- 500 Hilltop Dr
- 4552 Alta Mesa Dr Unit ADU
- 1258 Mistletoe Ln
- 1258 Mistletoe Ln