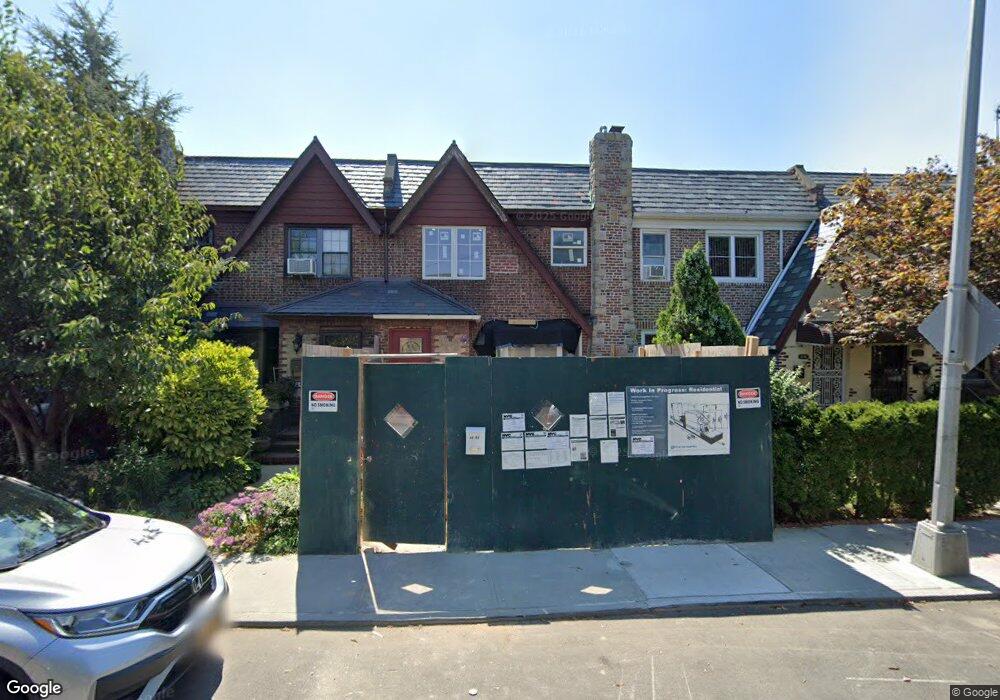
85-58 67th Rd Flushing, NY 11374
Rego Park NeighborhoodEstimated Value: $701,000 - $977,011
3
Beds
2
Baths
1,780
Sq Ft
$493/Sq Ft
Est. Value
About This Home
This home is located at 85-58 67th Rd, Flushing, NY 11374 and is currently estimated at $877,003, approximately $492 per square foot. 85-58 67th Rd is a home located in Queens County with nearby schools including P.S. 174 - William Sidney Mount, J.H.S. 190 Russell Sage, and Queens Metropolitan High School.
Ownership History
Date
Name
Owned For
Owner Type
Purchase Details
Closed on
Jan 29, 2021
Sold by
Mannino Frank
Bought by
Laohakul Tara and Reyes Gustavo
Current Estimated Value
Home Financials for this Owner
Home Financials are based on the most recent Mortgage that was taken out on this home.
Original Mortgage
$580,800
Outstanding Balance
$518,560
Interest Rate
2.6%
Mortgage Type
Purchase Money Mortgage
Estimated Equity
$358,443
Purchase Details
Closed on
Sep 18, 2020
Sold by
Buscemi Family Trust
Bought by
Mannino Frank
Home Financials for this Owner
Home Financials are based on the most recent Mortgage that was taken out on this home.
Original Mortgage
$480,000
Interest Rate
2.9%
Mortgage Type
New Conventional
Purchase Details
Closed on
Oct 6, 2011
Sold by
Buscemi Antoinette
Bought by
Buscemi Family Trust Dated December 16
Purchase Details
Closed on
Sep 25, 2008
Sold by
Bubscemi Grace and Buscemi Antoinette
Bought by
Antoinette Buscemi As Trustee and Buscemi Family Trust
Create a Home Valuation Report for This Property
The Home Valuation Report is an in-depth analysis detailing your home's value as well as a comparison with similar homes in the area
Home Values in the Area
Average Home Value in this Area
Purchase History
| Date | Buyer | Sale Price | Title Company |
|---|---|---|---|
| Laohakul Tara | $726,000 | -- | |
| Mannino Frank | $640,000 | -- | |
| Buscemi Family Trust Dated December 16 | -- | -- | |
| Antoinette Buscemi As Trustee | -- | -- |
Source: Public Records
Mortgage History
| Date | Status | Borrower | Loan Amount |
|---|---|---|---|
| Open | Laohakul Tara | $580,800 | |
| Previous Owner | Mannino Frank | $480,000 |
Source: Public Records
Tax History
| Year | Tax Paid | Tax Assessment Tax Assessment Total Assessment is a certain percentage of the fair market value that is determined by local assessors to be the total taxable value of land and additions on the property. | Land | Improvement |
|---|---|---|---|---|
| 2025 | $7,424 | $40,776 | $11,505 | $29,271 |
| 2024 | $7,424 | $39,843 | $11,882 | $27,961 |
| 2023 | $6,993 | $37,696 | $11,247 | $26,449 |
| 2022 | $6,292 | $57,900 | $17,580 | $40,320 |
| 2021 | $6,876 | $53,640 | $17,580 | $36,060 |
| 2020 | $6,255 | $53,640 | $17,580 | $36,060 |
| 2019 | $6,011 | $56,160 | $17,580 | $38,580 |
| 2018 | $5,476 | $30,097 | $12,163 | $17,934 |
| 2017 | $5,197 | $28,663 | $12,763 | $15,900 |
| 2016 | $4,822 | $28,663 | $12,763 | $15,900 |
| 2015 | $2,823 | $27,219 | $15,640 | $11,579 |
| 2014 | $2,823 | $26,572 | $16,244 | $10,328 |
Source: Public Records
Map
Nearby Homes
- 8505 67th Dr
- 8501 67th Dr
- 85-45 67th Rd
- 85-62 67th Dr
- 85-32 68th Ave
- 85-90 67th Ave
- 7510 Yellowstone Blvd Unit 5F
- 7510 Yellowstone Blvd Unit 2C
- 7510 Yellowstone Blvd Unit 5L
- 85-76 66th Rd
- 74-45 Yellowstone Blvd Unit 2
- 7445 Yellowstone Blvd Unit 5G
- 66-92 Selfridge St Unit 5C
- 66-92 Selfridge St Unit 3E
- 66-92 Selfridge St Unit 1E
- 7285 Yellowstone Blvd
- 67-31 Ingram St
- 90-01 68th Ave
- 67-54 Groton St
- 68-20 Selfridge St Unit 6J
Your Personal Tour Guide
Ask me questions while you tour the home.