Estimated Value: $438,000 - $567,000
3
Beds
2
Baths
3,197
Sq Ft
$154/Sq Ft
Est. Value
About This Home
This home is located at 85 Carriage Hill Rd, Epsom, NH 03234 and is currently estimated at $491,053, approximately $153 per square foot. 85 Carriage Hill Rd is a home located in Merrimack County with nearby schools including Epsom Central School, Cornerstone Christian Academy, and Epsom Better Buddies.
Ownership History
Date
Name
Owned For
Owner Type
Purchase Details
Closed on
Aug 30, 2019
Sold by
Goodson Danielle P
Bought by
Fredyma Daniel J and Fredyma Heather A
Current Estimated Value
Home Financials for this Owner
Home Financials are based on the most recent Mortgage that was taken out on this home.
Original Mortgage
$255,290
Outstanding Balance
$225,370
Interest Rate
3.99%
Mortgage Type
FHA
Estimated Equity
$265,683
Purchase Details
Closed on
Mar 22, 2012
Sold by
Miniutti Scott
Bought by
Pease Danielle and Goodson Casey M
Purchase Details
Closed on
Dec 16, 2003
Sold by
Gmac Global Relocation
Bought by
Miniutti Scott and Miniutti Amy
Home Financials for this Owner
Home Financials are based on the most recent Mortgage that was taken out on this home.
Original Mortgage
$209,250
Interest Rate
5.9%
Mortgage Type
Purchase Money Mortgage
Create a Home Valuation Report for This Property
The Home Valuation Report is an in-depth analysis detailing your home's value as well as a comparison with similar homes in the area
Home Values in the Area
Average Home Value in this Area
Purchase History
| Date | Buyer | Sale Price | Title Company |
|---|---|---|---|
| Fredyma Daniel J | $260,000 | -- | |
| Pease Danielle | $182,600 | -- | |
| Pease Danielle | $182,600 | -- | |
| Miniutti Scott | $237,500 | -- | |
| Miniutti Scott | $237,500 | -- |
Source: Public Records
Mortgage History
| Date | Status | Borrower | Loan Amount |
|---|---|---|---|
| Open | Fredyma Daniel J | $255,290 | |
| Previous Owner | Miniutti Scott | $209,250 | |
| Closed | Miniutti Scott | $0 |
Source: Public Records
Tax History Compared to Growth
Tax History
| Year | Tax Paid | Tax Assessment Tax Assessment Total Assessment is a certain percentage of the fair market value that is determined by local assessors to be the total taxable value of land and additions on the property. | Land | Improvement |
|---|---|---|---|---|
| 2024 | $8,128 | $305,100 | $99,000 | $206,100 |
| 2023 | $7,515 | $305,100 | $99,000 | $206,100 |
| 2022 | $7,274 | $305,100 | $99,000 | $206,100 |
| 2021 | $7,213 | $305,100 | $99,000 | $206,100 |
| 2020 | $6,660 | $305,100 | $99,000 | $206,100 |
| 2019 | $6,797 | $250,900 | $80,800 | $170,100 |
| 2018 | $6,516 | $250,900 | $80,800 | $170,100 |
| 2017 | $6,677 | $260,100 | $80,800 | $179,300 |
| 2016 | $6,510 | $260,100 | $80,800 | $179,300 |
| 2015 | $6,196 | $260,100 | $80,800 | $179,300 |
| 2014 | $5,910 | $265,500 | $75,300 | $190,200 |
| 2013 | $5,992 | $265,500 | $75,300 | $190,200 |
Source: Public Records
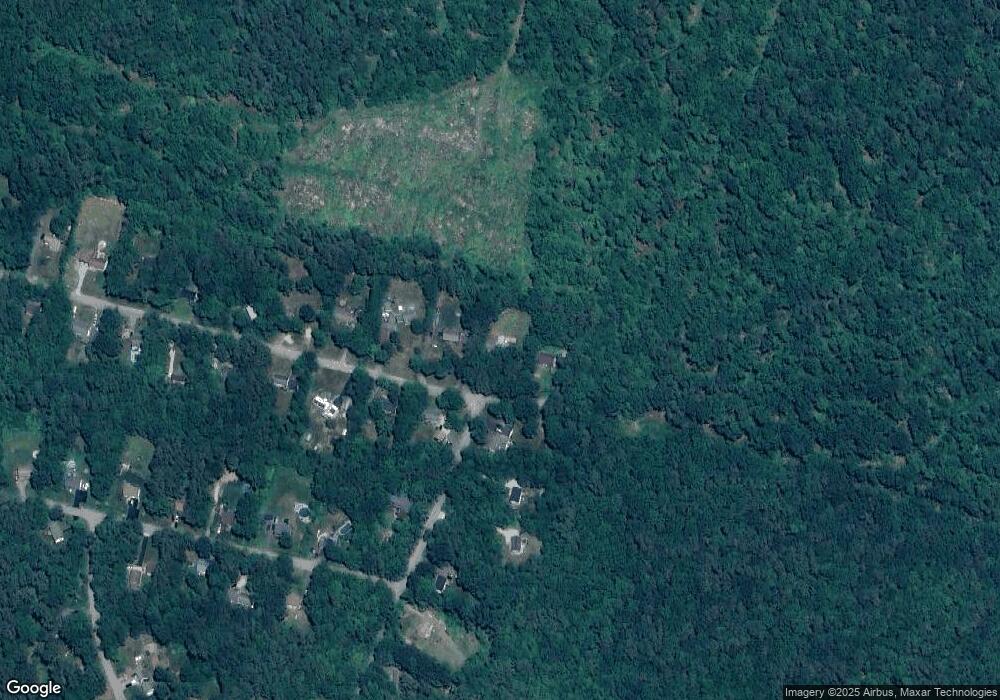
Map
Nearby Homes
- 0 Dover Unit 5027742
- 19 Depot Rd
- 43 Black Hall Rd Unit A2
- 42 Windymere Dr
- 280 Webster Mills Rd
- 19 Silver Hill Dr
- 15 Canterbury Rd
- 116 Webster Mills Rd
- 67 Swiggey Brook Rd
- 132 Chestnut Pond Rd
- 20 Mountain Rd
- 14 Short Falls Rd
- 268 Mountain Rd
- 19 Meadow Lark Ln
- 27 Tyler Ave
- 9 Princess Ln
- 18 Catamount Rd
- 804 Catamount Rd
- 1563 1st New Hampshire Turnpike
- 0A Old Turnpike Rd
- 91 Carriage Hill Rd
- 81 Carriage Hill Rd
- 82 Carriage Hill Rd
- 42 Briar Wood Dr
- 71 Carriage Hill Rd
- 72 Carriage Hill Rd
- 67 Carriage Hill Rd
- 38 Briar Wood Dr
- 66 Carriage Hill Rd
- 33 Briar Wood Dr
- 48 Briar Wood Dr
- 63 Carriage Hill Rd
- 62 Carriage Hill Rd
- 30 Briar Wood Dr
- 47 Colonial Dr
- 59 Carriage Hill Rd
- 56 Carriage Hill Rd
- 43 Colonial Dr
- 22 Briar Wood Dr
- 35 Colonial Dr