M
Seller's Agent in 2013
Maureen Fagan
RE/MAX Spectrum


Estimated Value: $737,000 - $807,942
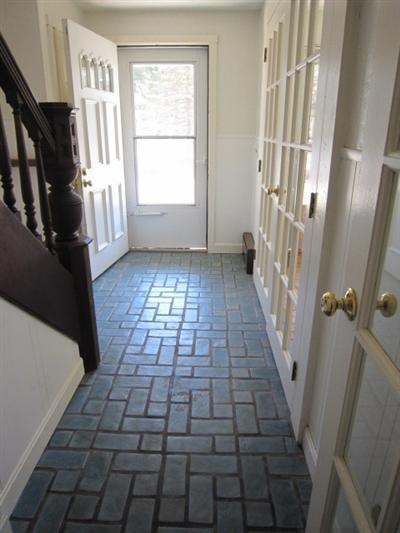
N. EASTHAM-Oceanside of town-Over 2,000 sq ft of Living Space. 1st fl offers a tiled entrance hall leading to the LR w a full brick walled fireplace & wood flooring + 2 French Door entrances, KITCH & Dining Area off the LR opening to a 3 Season Porch off the back of the house + spacious deck. Also Full BTH & 2 other rooms w side entrance on the right side of this home - great TV/Entertainment rooms. Upstairs 4 BRs & 2nd BTH, MBR offers Cathedral Ceilings. Lower walkout level has the 3rd BTH, 2nd brick FP, office, great Family Room, private entrance and utility/laundry room. Come see this home and decide how you will use all this space - the lowere level is not included in the Living Space. Needs work which is reflected in the price of $299,900.00.
Last Agent to Sell the Property
Maureen Fagan
RE/MAX Spectrum Listed on: 03/25/2011
Last Buyer's Agent
Maureen Fagan
RE/MAX Spectrum Listed on: 03/25/2011
We collect this data history from publicly available records. To have your information removed, we recommend requesting removal directly through your county’s website.
We collect this data history from publicly available records. To have your information removed, we recommend requesting removal directly through your county’s website.
| Date | Buyer | Sale Price | Title Company |
|---|---|---|---|
| -- | -- | ||
| $240,000 | -- | ||
| $146,000 | -- |
We collect this data history from publicly available records. To have your information removed, we recommend requesting removal directly through your county’s website.
| Date | Status | Borrower | Loan Amount |
|---|---|---|---|
| Previous Owner | $100,000 | ||
| Previous Owner | $461,250 | ||
| Previous Owner | $131,400 |
We collect this data history from publicly available records. To have your information removed, we recommend requesting removal directly through your county’s website.
| Date | Event | Price | List to Sale | Price per Sq Ft |
|---|---|---|---|---|
| 02/15/2013 02/15/13 | Sold | $240,000 | -42.6% | $118 / Sq Ft |
| 01/05/2013 01/05/13 | Pending | -- | -- | -- |
| 03/25/2011 03/25/11 | For Sale | $418,000 | -- | $205 / Sq Ft |
We collect this data history from publicly available records. To have your information removed, we recommend requesting removal directly through your county’s website.
| Year | Tax Paid | Tax Assessment Tax Assessment Total Assessment is a certain percentage of the fair market value that is determined by local assessors to be the total taxable value of land and additions on the property. | Land | Improvement |
|---|---|---|---|---|
| 2025 | $5,129 | $665,200 | $263,500 | $401,700 |
| 2024 | $4,528 | $646,000 | $255,800 | $390,200 |
| 2023 | $4,209 | $581,400 | $236,900 | $344,500 |
| 2022 | $3,969 | $462,600 | $211,500 | $251,100 |
| 2021 | $3,889 | $423,600 | $192,300 | $231,300 |
| 2020 | $3,628 | $416,100 | $196,200 | $219,900 |
| 2019 | $3,356 | $406,800 | $190,500 | $216,300 |
| 2018 | $3,321 | $397,700 | $185,000 | $212,700 |
| 2017 | $3,099 | $392,300 | $181,300 | $211,000 |
| 2016 | $2,949 | $396,400 | $181,300 | $215,100 |
| 2015 | $2,710 | $381,700 | $177,800 | $203,900 |
M
Seller's Agent in 2013
Maureen Fagan
RE/MAX Spectrum
Source: Cape Cod & Islands Association of REALTORS®
MLS Number: 21102529
APN: EAST-000012-000000-000257
Disclaimer: Certain information contained herein is derived from information provided by parties other than Homes.com. All information provided is deemed reliable, but is not guaranteed to be accurate and should be independently verified.
![]() All data relating to real estate for sale on this page comes from the Broker Reciprocity (BR) of the Cape Cod & Islands Multiple Listing Service, Inc. Detailed information about real estate listings held by brokerage firms other than CC&I Assoc. of REALTORS®, Inc. includes the name of the listing company. Neither the listing company nor CC&I Assoc. of REALTORS®, Inc. shall be responsible for any typographical errors, misinformation, misprints and shall be held totally harmless. The Broker providing this data believes it to be correct, but advises interested parties to confirm any item before relying on it in a purchase decision. All properties are subject to prior sale, changes, or withdrawal. Copyright 2026 © Cape Cod & Islands Multiple Listing Service, Inc. All rights reserved.
All data relating to real estate for sale on this page comes from the Broker Reciprocity (BR) of the Cape Cod & Islands Multiple Listing Service, Inc. Detailed information about real estate listings held by brokerage firms other than CC&I Assoc. of REALTORS®, Inc. includes the name of the listing company. Neither the listing company nor CC&I Assoc. of REALTORS®, Inc. shall be responsible for any typographical errors, misinformation, misprints and shall be held totally harmless. The Broker providing this data believes it to be correct, but advises interested parties to confirm any item before relying on it in a purchase decision. All properties are subject to prior sale, changes, or withdrawal. Copyright 2026 © Cape Cod & Islands Multiple Listing Service, Inc. All rights reserved.
Ask me questions while you tour the home.