Estimated Value: $94,000 - $181,000
Studio
--
Bath
1,698
Sq Ft
$76/Sq Ft
Est. Value
About This Home
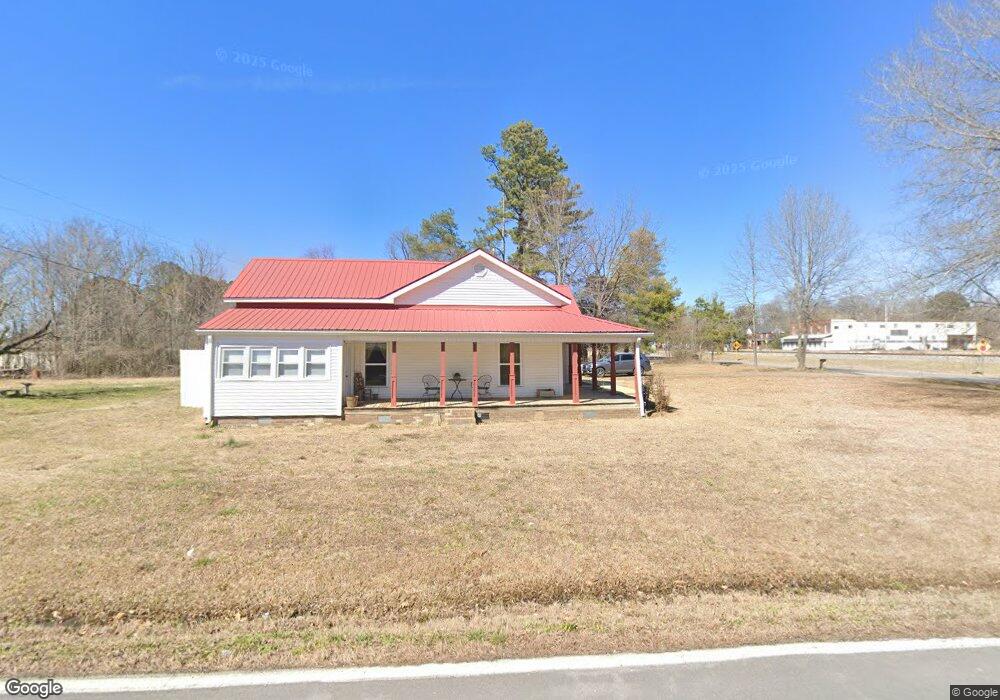
This home is located at 85 Chewalla Rd, Ramer, TN 38367 and is currently estimated at $128,611, approximately $75 per square foot. 85 Chewalla Rd is a home with nearby schools including Ramer Elementary School, Michie Elementary School, and Selmer Elementary School.
Ownership History
Date
Name
Owned For
Owner Type
Purchase Details
Closed on
Jul 18, 2022
Sold by
Dillon Lisa R and Dillon James R
Bought by
Dillon Allison P
Current Estimated Value
Home Financials for this Owner
Home Financials are based on the most recent Mortgage that was taken out on this home.
Original Mortgage
$158,585
Outstanding Balance
$150,655
Interest Rate
5.09%
Mortgage Type
New Conventional
Estimated Equity
-$22,044
Purchase Details
Closed on
Apr 29, 2020
Sold by
Warren Charlotte and Jarnagin Charles D
Bought by
Dillon Lisa and Dillon James R
Purchase Details
Closed on
Jul 10, 2007
Sold by
Jim Gray
Bought by
Robertson Bennie J
Purchase Details
Closed on
Feb 10, 1995
Bought by
Gray Jim Linda
Purchase Details
Closed on
Feb 7, 1995
Purchase Details
Closed on
Feb 9, 1994
Bought by
Jordan Melissa Ann
Purchase Details
Closed on
Oct 29, 1993
Bought by
Derryberry Terry and Derryberry Brenda
Create a Home Valuation Report for This Property
The Home Valuation Report is an in-depth analysis detailing your home's value as well as a comparison with similar homes in the area
Purchase History
| Date | Buyer | Sale Price | Title Company |
|---|---|---|---|
| Dillon Allison P | $157,000 | Deusner & Kennedy Pa | |
| Dillon Lisa | $39,600 | None Available | |
| Robertson Bennie J | $49,000 | -- | |
| Gray Jim Linda | $34,000 | -- | |
| -- | $34,000 | -- | |
| Jordan Melissa Ann | $37,000 | -- | |
| Derryberry Terry | $22,000 | -- |
Source: Public Records
Mortgage History
| Date | Status | Borrower | Loan Amount |
|---|---|---|---|
| Open | Dillon Allison P | $158,585 |
Source: Public Records
Tax History
| Year | Tax Paid | Tax Assessment Tax Assessment Total Assessment is a certain percentage of the fair market value that is determined by local assessors to be the total taxable value of land and additions on the property. | Land | Improvement |
|---|---|---|---|---|
| 2025 | $372 | $23,575 | $1,450 | $22,125 |
| 2024 | $372 | $23,575 | $1,450 | $22,125 |
| 2023 | $372 | $23,575 | $1,450 | $22,125 |
| 2022 | $372 | $23,575 | $1,450 | $22,125 |
| 2021 | $336 | $16,400 | $1,375 | $15,025 |
| 2020 | $277 | $13,525 | $1,375 | $12,150 |
| 2019 | $277 | $13,525 | $1,375 | $12,150 |
| 2018 | $277 | $13,525 | $1,375 | $12,150 |
| 2017 | $277 | $13,525 | $1,375 | $12,150 |
| 2016 | $271 | $13,525 | $1,375 | $12,150 |
| 2015 | $283 | $13,525 | $1,375 | $12,150 |
| 2014 | $271 | $12,950 | $1,375 | $11,575 |
Source: Public Records
Map
Nearby Homes
- 4274 Highway 57 W
- 0 Chewalla Rd
- 4083 Tennessee 57
- 4083 Highway 57 W
- 3285 Tennessee 57
- 0 Luther Ingle Rd
- 1304 Luther Ingle Rd
- 183 Matlock Rd
- 4791 Guys Chewalla Rd
- 0 Guys Chewalla Rd Unit 11632359
- 0 Guys Chewalla Rd Unit LotWP0001 24020167
- 0 Guys Chewalla Rd
- 404 Highway 57 W
- 6052 U S 45
- 34 Gravel Hill Rd
- 6907 U S 45
- 00 Hannah Dr
- 0 Butler Chapel Rd
- 7749 Highway 45 S
- 82 Shane Ln
- 17 Mount Vernon Rd
- 131 Chewalla Rd
- 138 Chewalla Rd
- 0 Tennessee 57
- 0 57 Hwy W Unit 10029921
- 0 57 Hwy W Unit 3257679
- 0 57 Hwy W Unit 9995642
- 00 Hwy 57 Hwy W
- 0 57 Hwy W Unit 10101564
- 0 57 Hwy W Unit 10059321
- 0 57 Hwy W Unit 10056358
- 7537 Tennessee 57
- 175 Chewalla Rd
- 160 Chewalla Rd
- 62 Friendship Rd
- 4531 Highway 57 W
- 45 S Hwy
- 00 Dell Arbor Cir
- 0 Ballpark Rd Unit 3155510
- 0 Ashleigh Ln Unit 3127761
Your Personal Tour Guide
Ask me questions while you tour the home.