B
Seller's Agent in 2017
Brian McMahon
RE/MAX

Estimated Value: $925,799 - $1,073,000
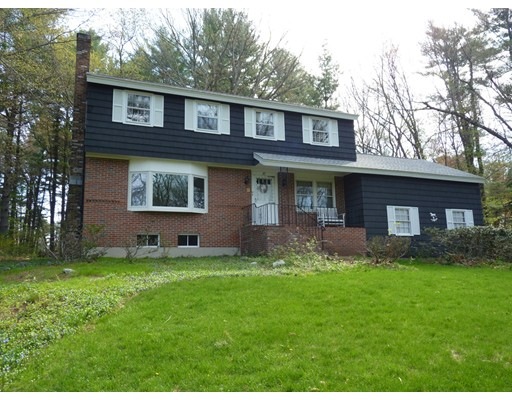
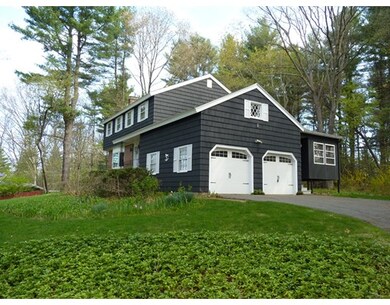
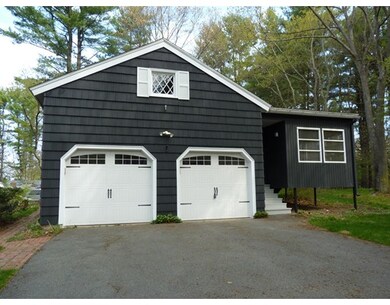
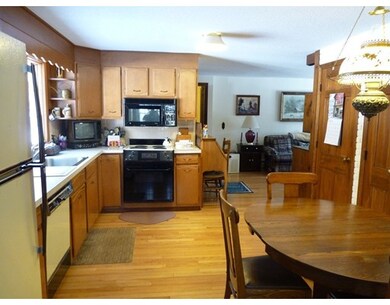
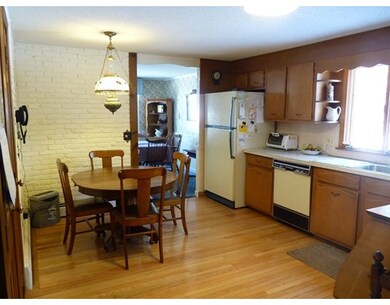
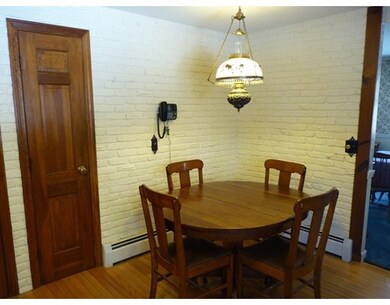
This Adorable Colonial is Ready for a New Owner and to raise a family. The home is Larger Than it First Appears, the 4 Bedroom, 2.5 Bath, 2 Car Garage Home Has Over 2000 sq ft Located on a Gorgeous 43,996 Private Lot. Good Sized Rooms w/Tons of Hardwood and Light. Formal Living Room with wood-burning fireplace. Kitchen is very open with views to back yard. Cozy Family Room. Master is Complete with private shower, toilet and sink and Large Closet. Full Walk-out Basement is Ready for Finishing.Town Water and Sewer and Quick Access to Rte 93. Short Distance to High Plain Elementary and Wood Hill Middle School. This home has lots and lots of potential.
Last Agent to Sell the Property
Brian McMahon
RE/MAX Innovative Properties Listed on: 02/15/2017

Home Type
Single Family
Year Built
1966
Lot Details
1.01 Acres
| Date | Buyer | Sale Price | Title Company |
|---|---|---|---|
| Mackenzie Vaughan | $531,500 | -- |
| Date | Status | Borrower | Loan Amount |
|---|---|---|---|
| Open | Mackenzie Vaughan | $424,000 |
| Date | Event | Price | List to Sale | Price per Sq Ft |
|---|---|---|---|---|
| 08/11/2017 08/11/17 | Sold | $531,500 | -3.3% | $258 / Sq Ft |
| 06/07/2017 06/07/17 | Pending | -- | -- | -- |
| 04/28/2017 04/28/17 | For Sale | $549,900 | 0.0% | $267 / Sq Ft |
| 04/22/2017 04/22/17 | Pending | -- | -- | -- |
| 03/09/2017 03/09/17 | Price Changed | $549,900 | -3.5% | $267 / Sq Ft |
| 02/15/2017 02/15/17 | For Sale | $569,900 | -- | $277 / Sq Ft |
| Year | Tax Paid | Tax Assessment Tax Assessment Total Assessment is a certain percentage of the fair market value that is determined by local assessors to be the total taxable value of land and additions on the property. | Land | Improvement |
|---|---|---|---|---|
| 2024 | $9,938 | $771,600 | $444,400 | $327,200 |
| 2023 | $9,502 | $695,600 | $400,400 | $295,200 |
| 2022 | $8,924 | $611,200 | $348,100 | $263,100 |
| 2021 | $8,530 | $557,900 | $316,300 | $241,600 |
| 2020 | $8,179 | $544,900 | $308,500 | $236,400 |
| 2019 | $8,104 | $530,700 | $299,400 | $231,300 |
| 2018 | $7,833 | $500,800 | $288,000 | $212,800 |
| 2017 | $7,490 | $493,400 | $282,400 | $211,000 |
| 2016 | $7,339 | $495,200 | $282,400 | $212,800 |
| 2015 | $7,094 | $473,900 | $271,500 | $202,400 |
B
Seller's Agent in 2017
Brian McMahon
RE/MAX
Buyer's Agent in 2017
Janet Roach Enegren
RE/MAX
(781) 321-9393
33 Total Sales
Source: MLS Property Information Network (MLS PIN)
MLS Number: 72120113
APN: ANDO-000206-000002-A000000
Disclaimer: Certain information contained herein is derived from information provided by parties other than Homes.com. All information provided is deemed reliable, but is not guaranteed to be accurate and should be independently verified.
![]() The property listing data and information, or the Images, set forth herein were provided to MLS Property Information Network, Inc. from third party sources, including sellers, lessors and public records, and were compiled by MLS Property Information Network, Inc. The property listing data and information, and the Images, are for the personal, non-commercial use of consumers having a good faith interest in purchasing or leasing listed properties of the type displayed to them and may not be used for any purpose other than to identify prospective properties which such consumers may have a good faith interest in purchasing or leasing. MLS Property Information Network, Inc. and its subscribers disclaim any and all representations and warranties as to the accuracy of the property listing data and information, or as to the accuracy of any of the Images, set forth herein.
The property listing data and information, or the Images, set forth herein were provided to MLS Property Information Network, Inc. from third party sources, including sellers, lessors and public records, and were compiled by MLS Property Information Network, Inc. The property listing data and information, and the Images, are for the personal, non-commercial use of consumers having a good faith interest in purchasing or leasing listed properties of the type displayed to them and may not be used for any purpose other than to identify prospective properties which such consumers may have a good faith interest in purchasing or leasing. MLS Property Information Network, Inc. and its subscribers disclaim any and all representations and warranties as to the accuracy of the property listing data and information, or as to the accuracy of any of the Images, set forth herein.
Ask me questions while you tour the home.