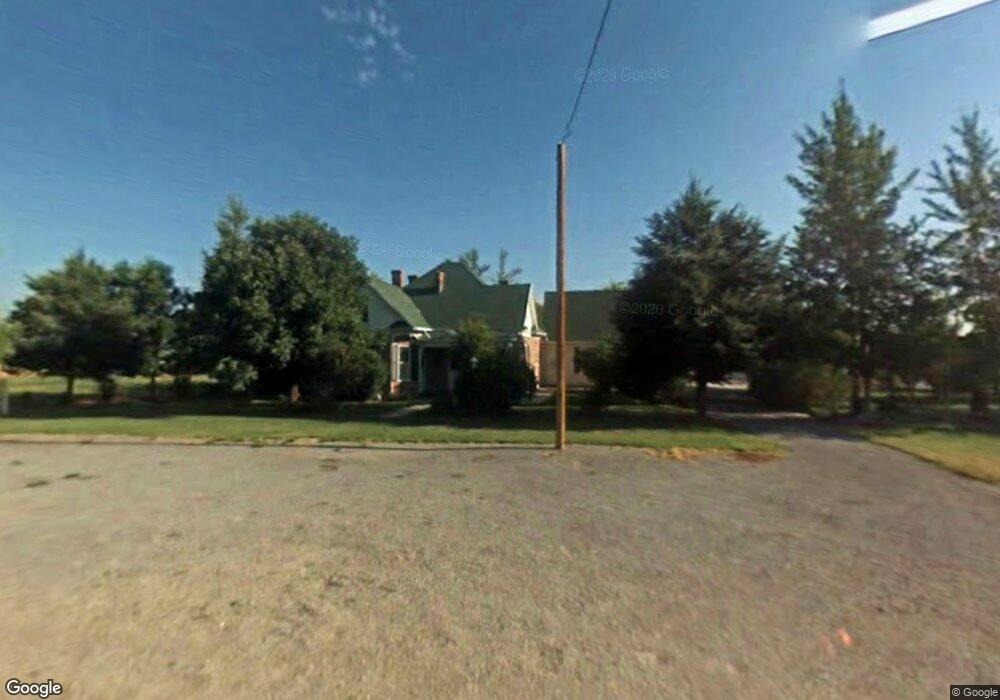
85 E Center St Kanosh, UT 84637
Estimated Value: $319,000 - $382,000
3
Beds
2
Baths
2,064
Sq Ft
$172/Sq Ft
Est. Value
About This Home
This home is located at 85 E Center St, Kanosh, UT 84637 and is currently estimated at $354,370, approximately $171 per square foot. 85 E Center St is a home located in Millard County.
Ownership History
Date
Name
Owned For
Owner Type
Purchase Details
Closed on
Sep 23, 2019
Sold by
Olson Dusty Lynn and Olson Diana L
Bought by
Cain Shad J
Current Estimated Value
Home Financials for this Owner
Home Financials are based on the most recent Mortgage that was taken out on this home.
Original Mortgage
$186,558
Outstanding Balance
$162,711
Interest Rate
3.5%
Mortgage Type
FHA
Estimated Equity
$191,659
Purchase Details
Closed on
Sep 20, 2019
Sold by
Cain Shad J
Bought by
Cain Shad J and Cain Amanda
Home Financials for this Owner
Home Financials are based on the most recent Mortgage that was taken out on this home.
Original Mortgage
$186,558
Outstanding Balance
$162,711
Interest Rate
3.5%
Mortgage Type
FHA
Estimated Equity
$191,659
Purchase Details
Closed on
Aug 21, 2007
Sold by
Phillips Diane L
Bought by
Olson Diana L
Home Financials for this Owner
Home Financials are based on the most recent Mortgage that was taken out on this home.
Original Mortgage
$124,000
Interest Rate
6.74%
Mortgage Type
New Conventional
Purchase Details
Closed on
Oct 30, 2006
Sold by
Phillips Diane L and Phillips Ryan N
Bought by
Phillips Diane L
Create a Home Valuation Report for This Property
The Home Valuation Report is an in-depth analysis detailing your home's value as well as a comparison with similar homes in the area
Purchase History
| Date | Buyer | Sale Price | Title Company |
|---|---|---|---|
| Cain Shad J | -- | First American Title | |
| Cain Shad J | -- | First American Title | |
| Olson Diana L | -- | -- | |
| Phillips Diane L | -- | -- |
Source: Public Records
Mortgage History
| Date | Status | Borrower | Loan Amount |
|---|---|---|---|
| Open | Cain Shad J | $186,558 | |
| Previous Owner | Olson Diana L | $124,000 |
Source: Public Records
Tax History
| Year | Tax Paid | Tax Assessment Tax Assessment Total Assessment is a certain percentage of the fair market value that is determined by local assessors to be the total taxable value of land and additions on the property. | Land | Improvement |
|---|---|---|---|---|
| 2025 | $1,429 | $187,143 | $32,981 | $154,162 |
| 2024 | $1,429 | $191,918 | $19,709 | $172,209 |
| 2023 | $1,747 | $191,918 | $19,709 | $172,209 |
| 2022 | $1,238 | $116,267 | $15,766 | $100,501 |
| 2021 | $1,198 | $108,563 | $13,710 | $94,853 |
| 2020 | $1,038 | $94,993 | $12,464 | $82,529 |
| 2019 | $921 | $84,747 | $11,435 | $73,312 |
| 2018 | $888 | $83,707 | $10,395 | $73,312 |
| 2017 | $929 | $83,707 | $10,395 | $73,312 |
| 2016 | $829 | $78,011 | $7,796 | $70,215 |
| 2015 | $830 | $78,011 | $7,796 | $70,215 |
| 2014 | -- | $78,011 | $7,796 | $70,215 |
| 2013 | -- | $78,011 | $7,796 | $70,215 |
Source: Public Records
Map
Nearby Homes
- 135 E 200 N
- 115 W 200 S
- 58 E 300 South St
- 73 E 700 S
- 0 County Road 4616
- Parcel # 8816
- 145 N 200 E
- 80 W 470 N
- 50 N 100 Rd E
- 479 E 100 N
- 1565 W Sunflower Ln Unit 3
- 1615 W Sunflower Ln
- 1615 W Sunflower Ln Unit 4
- 1565 W Sunflower Ln
- 2000 N West Frontage I-15
- 1100 S 725 Rd W
- 310 S 500 West Rd
- 465 S 100 W
- 760 E 700 St S
- 155 E 500 St S
- 65 E Center
- 80 E Center St
- 113 E Center St
- 70 E Center St
- 70 W Center St
- 40 N 100 E
- 50 E Center St
- 35 E Center St
- 120 E Center St
- 45 S 100 E
- 10 N Main St
- 90 E 100 N
- 70 E 100 N
- 60 S 100 E
- 110 E 100 N
- 0 NE S 28 T 25s R 9w E1 2 Sec 28 T25s R9w Slm Unit 99471
- 160 E Center St
- 50 N Main St
- 65 S 100 E
- 175 E Center St
Your Personal Tour Guide
Ask me questions while you tour the home.