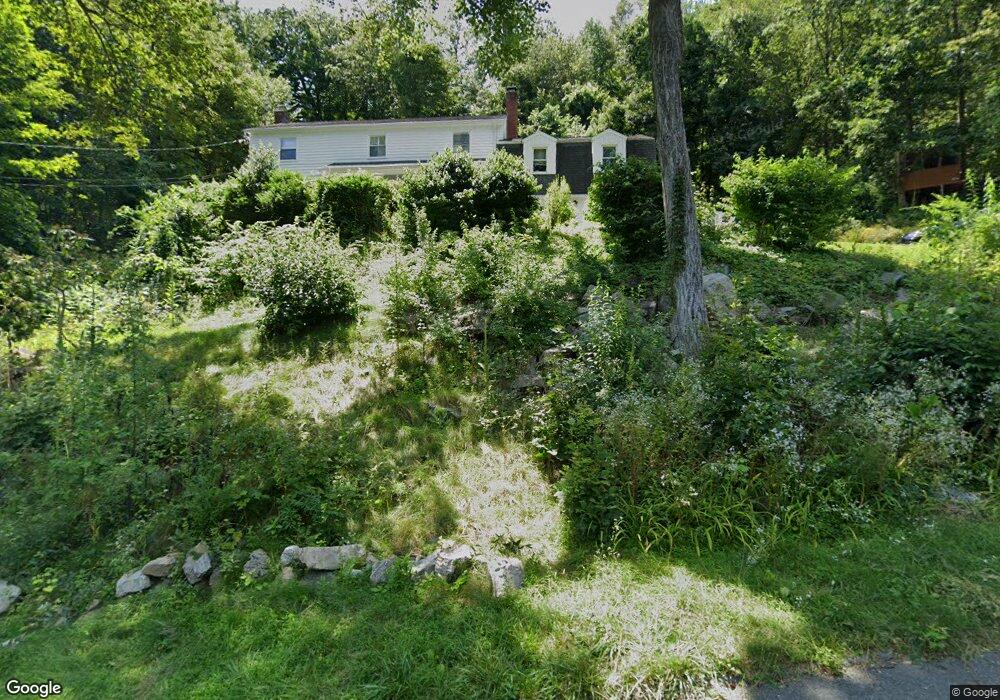
85 Fulling Mill Ln Ridgefield, CT 06877
Estimated Value: $968,000 - $1,217,000
3
Beds
3
Baths
2,706
Sq Ft
$388/Sq Ft
Est. Value
About This Home
This home is located at 85 Fulling Mill Ln, Ridgefield, CT 06877 and is currently estimated at $1,049,032, approximately $387 per square foot. 85 Fulling Mill Ln is a home located in Fairfield County with nearby schools including Farmingville Elementary School, Ridgefield High School, and Ridgefield Montessori School.
Ownership History
Date
Name
Owned For
Owner Type
Purchase Details
Closed on
Aug 3, 2009
Sold by
Armour Donald B and Armour Lucy Long
Bought by
Bonheim Michael C and Bonheim Ellen S
Current Estimated Value
Home Financials for this Owner
Home Financials are based on the most recent Mortgage that was taken out on this home.
Original Mortgage
$385,000
Outstanding Balance
$253,824
Interest Rate
5.43%
Estimated Equity
$795,208
Purchase Details
Closed on
Oct 8, 1992
Sold by
Burr Alan and Burr Suzanne
Bought by
Armour Donald and Armour Lucy
Home Financials for this Owner
Home Financials are based on the most recent Mortgage that was taken out on this home.
Original Mortgage
$232,000
Interest Rate
7.99%
Mortgage Type
Unknown
Purchase Details
Closed on
Apr 26, 1991
Sold by
Morgan Jeffrey and Morgan Heather
Bought by
Burr Alan and Burr Suzanne
Create a Home Valuation Report for This Property
The Home Valuation Report is an in-depth analysis detailing your home's value as well as a comparison with similar homes in the area
Home Values in the Area
Average Home Value in this Area
Purchase History
| Date | Buyer | Sale Price | Title Company |
|---|---|---|---|
| Bonheim Michael C | $535,000 | -- | |
| Armour Donald | $290,000 | -- | |
| Burr Alan | $277,000 | -- |
Source: Public Records
Mortgage History
| Date | Status | Borrower | Loan Amount |
|---|---|---|---|
| Open | Burr Alan | $385,000 | |
| Previous Owner | Burr Alan | $305,000 | |
| Previous Owner | Burr Alan | $310,000 | |
| Previous Owner | Burr Alan | $232,000 |
Source: Public Records
Tax History Compared to Growth
Tax History
| Year | Tax Paid | Tax Assessment Tax Assessment Total Assessment is a certain percentage of the fair market value that is determined by local assessors to be the total taxable value of land and additions on the property. | Land | Improvement |
|---|---|---|---|---|
| 2025 | $13,059 | $476,770 | $236,250 | $240,520 |
| 2024 | $12,563 | $476,770 | $236,250 | $240,520 |
| 2023 | $12,305 | $476,770 | $236,250 | $240,520 |
| 2022 | $11,741 | $412,970 | $173,250 | $239,720 |
| 2021 | $11,650 | $412,970 | $173,250 | $239,720 |
| 2020 | $11,613 | $412,970 | $173,250 | $239,720 |
| 2019 | $11,613 | $412,970 | $173,250 | $239,720 |
| 2018 | $11,472 | $412,970 | $173,250 | $239,720 |
| 2017 | $10,190 | $374,510 | $133,060 | $241,450 |
| 2016 | $9,996 | $374,510 | $133,060 | $241,450 |
| 2015 | $9,741 | $374,510 | $133,060 | $241,450 |
| 2014 | $9,741 | $374,510 | $133,060 | $241,450 |
Source: Public Records
Map
Nearby Homes
- 137 Walnut Grove Rd
- 46 Tally Ho Rd
- 80 Lounsbury Ln
- 176 Picketts Ridge Rd
- 7 Honeysuckle Ln
- 40 Hull Place
- 252 Florida Hill Rd
- 95 Ridgewood Rd
- 7 Elderberry Ln Unit 7
- 81 Picketts Ridge Rd
- 217 Danbury Rd
- 61 Marchant Rd
- 633 Danbury Rd Unit 21
- 34 Hickory Ln
- 77 Sunset Ln Unit 223
- 19 Prospect Ridge Unit 14
- 7 Guardhouse Dr
- 15 Laurel Hill Rd
- 31 Ridgecrest Dr
- 20 Olcott Way Unit 20
- 83 Fulling Mill Ln
- 87 Fulling Mill Ln
- 35 Lost Mine Place
- 69 Fulling Mill Ln
- 34 Lost Mine Place
- 75 Fulling Mill Ln
- 55 Fulling Mill Ln
- 70 Fulling Mill Ln
- 30 Lost Mine Place
- 88 Fulling Mill Ln
- 62 Fulling Mill Ln
- 27 Lost Mine Place
- 88 Saunders Ln
- 50 Fulling Mill Ln
- 33 Lost Mine Place
- 55 E Farm Ln
- 43 Fulling Mill Ln
- 100 Fulling Mill Ln
- 101 Fulling Mill Ln
- 19 Lost Mine Place