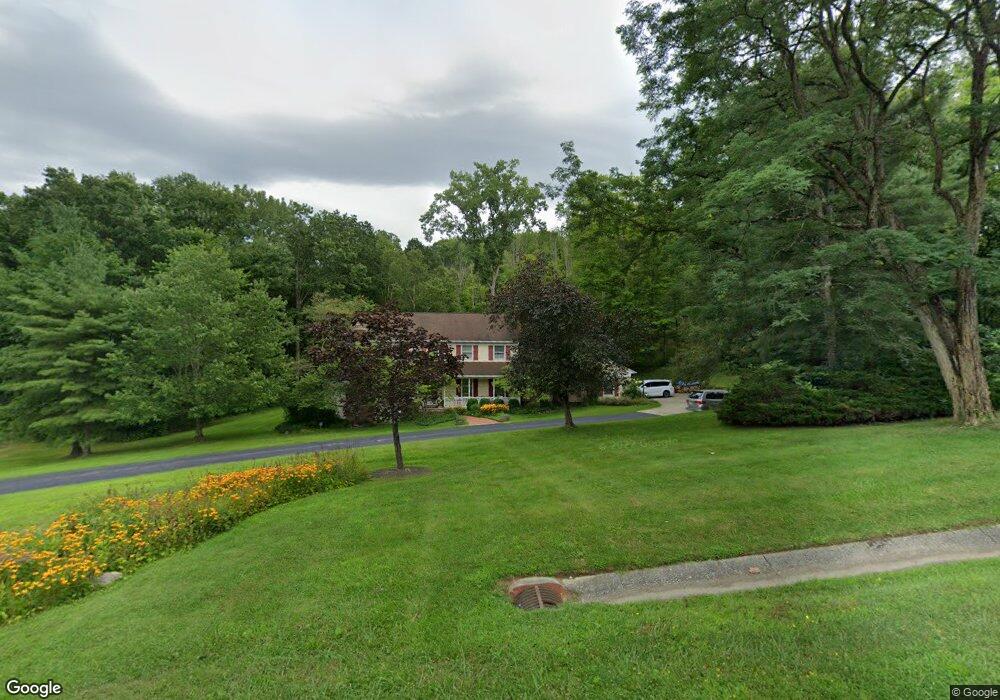
85 Greentree Rd Chagrin Falls, OH 44022
Estimated Value: $677,000 - $885,000
4
Beds
4
Baths
3,348
Sq Ft
$244/Sq Ft
Est. Value
About This Home
This home is located at 85 Greentree Rd, Chagrin Falls, OH 44022 and is currently estimated at $816,364, approximately $243 per square foot. 85 Greentree Rd is a home located in Cuyahoga County with nearby schools including Gurney Elementary School, Chagrin Falls Intermediate Elementary School, and Chagrin Falls Middle School.
Ownership History
Date
Name
Owned For
Owner Type
Purchase Details
Closed on
Feb 7, 1998
Sold by
Hartnett John J and Hartnett Paula K
Bought by
Nevans Marvin W and Nevans Charlene Z
Current Estimated Value
Home Financials for this Owner
Home Financials are based on the most recent Mortgage that was taken out on this home.
Original Mortgage
$180,000
Outstanding Balance
$25,589
Interest Rate
6.95%
Estimated Equity
$790,775
Purchase Details
Closed on
Nov 22, 1985
Bought by
Hartnett John J and Hartnett Paula K
Purchase Details
Closed on
May 28, 1985
Sold by
Case Robert M
Bought by
Louis J Marino & Assoc Inc
Purchase Details
Closed on
Dec 27, 1977
Sold by
Tortorici Anthony J and A S
Bought by
Case Robert M
Purchase Details
Closed on
Jan 1, 1975
Bought by
Tortorici Anthony J and A S
Create a Home Valuation Report for This Property
The Home Valuation Report is an in-depth analysis detailing your home's value as well as a comparison with similar homes in the area
Home Values in the Area
Average Home Value in this Area
Purchase History
| Date | Buyer | Sale Price | Title Company |
|---|---|---|---|
| Nevans Marvin W | $361,000 | Midland Title Security Inc | |
| Hartnett John J | $262,000 | -- | |
| Louis J Marino & Assoc Inc | $56,000 | -- | |
| Case Robert M | $31,000 | -- | |
| Tortorici Anthony J | -- | -- |
Source: Public Records
Mortgage History
| Date | Status | Borrower | Loan Amount |
|---|---|---|---|
| Open | Nevans Marvin W | $180,000 |
Source: Public Records
Tax History
| Year | Tax Paid | Tax Assessment Tax Assessment Total Assessment is a certain percentage of the fair market value that is determined by local assessors to be the total taxable value of land and additions on the property. | Land | Improvement |
|---|---|---|---|---|
| 2025 | $16,275 | $245,420 | $56,840 | $188,580 |
| 2024 | $16,461 | $245,420 | $56,840 | $188,580 |
| 2023 | $14,204 | $186,200 | $46,200 | $140,000 |
| 2022 | $14,970 | $186,200 | $46,200 | $140,000 |
| 2021 | $14,913 | $186,200 | $46,200 | $140,000 |
| 2020 | $14,133 | $164,780 | $40,880 | $123,900 |
| 2019 | $13,945 | $470,800 | $116,800 | $354,000 |
| 2018 | $6,938 | $164,780 | $40,880 | $123,900 |
| 2017 | $12,949 | $152,400 | $35,180 | $117,220 |
| 2016 | $11,665 | $152,400 | $35,180 | $117,220 |
| 2015 | $11,077 | $152,400 | $35,180 | $117,220 |
| 2014 | $11,077 | $142,420 | $32,870 | $109,550 |
Source: Public Records
Map
Nearby Homes
- 106 W Washington St
- 106 Solon Rd
- 26 Water St
- 60 South Ln
- 81 Hall St
- 318 Hillside Ln
- 315 Solon Rd Unit 309
- 270 North St
- 110 Emilia Ct
- 145 Greenbrier Dr
- 207 S Main St
- 213 S Main St
- 219 S Main St
- 225 S Main St
- 40 Highland Ln
- 633 Coy Ln
- 6331 Chagrin River Rd
- 3940 Ellendale Rd
- S/L Rocker Ave
- 35 Hopewell Trail
- 95 Greentree Rd
- 75 Greentree Rd
- 105 Greentree Rd
- 100 Greentree Rd
- 90 Greentree Rd
- 80 Greentree Rd
- 65 Greentree Rd
- 110 Greentree Rd
- 123 Greentree Rd
- 120 Greentree Rd
- 70 Greentree Rd
- 55 Greentree Rd
- 125 Greentree Rd
- 60 Greentree Rd
- 50 Greentree Rd
- 160 Greentree Rd
- 90 Skyline Dr
- 45 Greentree Rd
- 140 Greentree Rd
- 80 Skyline Dr
Your Personal Tour Guide
Ask me questions while you tour the home.