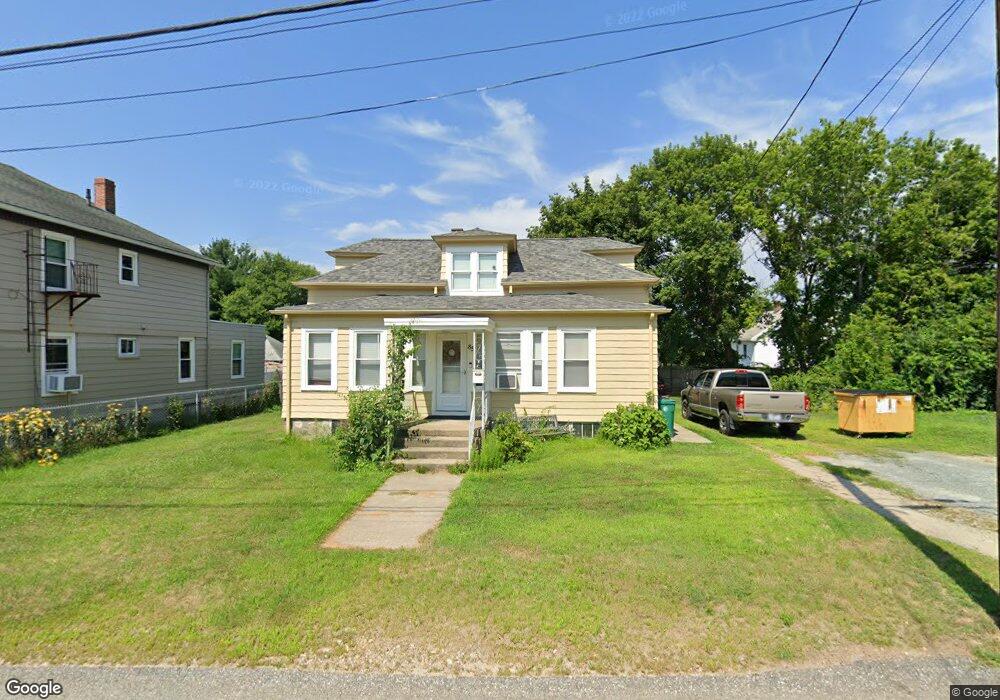
85 Loring St Woonsocket, RI 02895
East Woonsocket NeighborhoodEstimated Value: $280,000 - $400,000
4
Beds
2
Baths
1,500
Sq Ft
$231/Sq Ft
Est. Value
About This Home
This home is located at 85 Loring St, Woonsocket, RI 02895 and is currently estimated at $346,986, approximately $231 per square foot. 85 Loring St is a home located in Providence County with nearby schools including Woonsocket High School and Good Shepherd Catholic School.
Ownership History
Date
Name
Owned For
Owner Type
Purchase Details
Closed on
Jun 3, 2009
Sold by
Deutsche Bank Natl T C
Bought by
Provoyeur Matthew and Provoyeur Paula
Current Estimated Value
Purchase Details
Closed on
Feb 17, 2009
Sold by
Caruso Matthew R
Bought by
Deutsche Bank Natl T C
Purchase Details
Closed on
Jan 3, 2006
Sold by
Caruso Jeffrey W and Caruso Tina M
Bought by
Caruso Matthew R
Home Financials for this Owner
Home Financials are based on the most recent Mortgage that was taken out on this home.
Original Mortgage
$219,600
Interest Rate
6.39%
Mortgage Type
Purchase Money Mortgage
Purchase Details
Closed on
May 20, 2003
Sold by
Renaud Alice M and Lacroix Suzanne
Bought by
Caruso Jeffrey W
Create a Home Valuation Report for This Property
The Home Valuation Report is an in-depth analysis detailing your home's value as well as a comparison with similar homes in the area
Home Values in the Area
Average Home Value in this Area
Purchase History
| Date | Buyer | Sale Price | Title Company |
|---|---|---|---|
| Provoyeur Matthew | $82,500 | -- | |
| Deutsche Bank Natl T C | $129,430 | -- | |
| Caruso Matthew R | $244,000 | -- | |
| Caruso Jeffrey W | $145,000 | -- | |
| Provoyeur Matthew | $82,500 | -- | |
| Deutsche Bank Natl T C | $129,430 | -- | |
| Caruso Matthew R | $244,000 | -- | |
| Caruso Jeffrey W | $145,000 | -- |
Source: Public Records
Mortgage History
| Date | Status | Borrower | Loan Amount |
|---|---|---|---|
| Open | Caruso Jeffrey W | $117,000 | |
| Previous Owner | Caruso Jeffrey W | $219,600 |
Source: Public Records
Tax History
| Year | Tax Paid | Tax Assessment Tax Assessment Total Assessment is a certain percentage of the fair market value that is determined by local assessors to be the total taxable value of land and additions on the property. | Land | Improvement |
|---|---|---|---|---|
| 2025 | $3,734 | $332,500 | $107,600 | $224,900 |
| 2024 | $3,660 | $251,700 | $95,500 | $156,200 |
| 2023 | $3,519 | $251,700 | $95,500 | $156,200 |
| 2022 | $3,519 | $251,700 | $95,500 | $156,200 |
| 2021 | $3,686 | $155,200 | $60,000 | $95,200 |
| 2020 | $3,725 | $155,200 | $60,000 | $95,200 |
| 2018 | $3,737 | $155,200 | $60,000 | $95,200 |
| 2017 | $3,862 | $128,300 | $46,900 | $81,400 |
| 2016 | $4,085 | $128,300 | $46,900 | $81,400 |
| 2015 | $4,693 | $128,300 | $46,900 | $81,400 |
| 2014 | $4,485 | $124,800 | $51,600 | $73,200 |
Source: Public Records
Map
Nearby Homes
- 68 Kenwood St
- 375 Congress St
- 95 Mitris Blvd
- 727 Mendon Rd
- 42 Armand Ave
- 23 Rutland St
- 568 Elm St
- 34 Heroux Ave
- 56 Mailloux St
- 311 Elm St
- 110 Saint Leon Ave
- 212 Saint Louis Ave
- 271 Elm St
- 188 Saint Louis Ave
- 178 Saint Louis Ave
- 263 Elm St
- 202 Paine St
- 39 Louise St
- 410 Carrington Ave
- 414 Rhode Island Ave
Your Personal Tour Guide
Ask me questions while you tour the home.