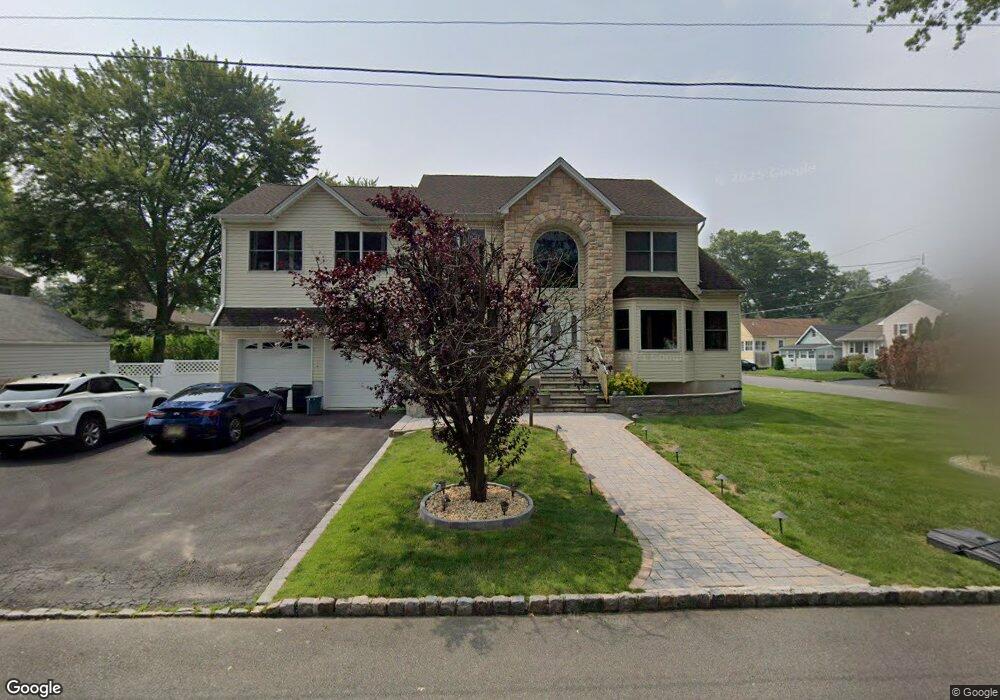
85 Papscoe Dr Parsippany, NJ 07054
Estimated Value: $907,436 - $1,043,000
Studio
--
Bath
2,987
Sq Ft
$319/Sq Ft
Est. Value
About This Home
This home is located at 85 Papscoe Dr, Parsippany, NJ 07054 and is currently estimated at $953,359, approximately $319 per square foot. 85 Papscoe Dr is a home located in Morris County with nearby schools including Eastlake Elementary School, Brooklawn Middle School, and Parsippany Hills High School.
Ownership History
Date
Name
Owned For
Owner Type
Purchase Details
Closed on
Oct 16, 2008
Sold by
Georgian Homes Inc
Bought by
Desai Nilesh and Desai Rajeshree
Current Estimated Value
Home Financials for this Owner
Home Financials are based on the most recent Mortgage that was taken out on this home.
Original Mortgage
$400,000
Outstanding Balance
$259,654
Interest Rate
5.94%
Mortgage Type
Purchase Money Mortgage
Estimated Equity
$693,705
Purchase Details
Closed on
Dec 4, 2007
Sold by
Hansen Everett W and Hansen Bernice W
Bought by
Georgian Homes Inc
Home Financials for this Owner
Home Financials are based on the most recent Mortgage that was taken out on this home.
Original Mortgage
$475,000
Interest Rate
8%
Mortgage Type
Construction
Purchase Details
Closed on
Jun 25, 1999
Sold by
Hansen Everett W and Hansen Bernice W
Bought by
Hansen Everett W and Hansen Bernice W
Create a Home Valuation Report for This Property
The Home Valuation Report is an in-depth analysis detailing your home's value as well as a comparison with similar homes in the area
Home Values in the Area
Average Home Value in this Area
Purchase History
| Date | Buyer | Sale Price | Title Company |
|---|---|---|---|
| Desai Nilesh | $660,001 | Multiple | |
| Georgian Homes Inc | $300,000 | None Available | |
| Hansen Everett W | -- | -- |
Source: Public Records
Mortgage History
| Date | Status | Borrower | Loan Amount |
|---|---|---|---|
| Open | Desai Nilesh | $400,000 | |
| Previous Owner | Georgian Homes Inc | $475,000 |
Source: Public Records
Tax History
| Year | Tax Paid | Tax Assessment Tax Assessment Total Assessment is a certain percentage of the fair market value that is determined by local assessors to be the total taxable value of land and additions on the property. | Land | Improvement |
|---|---|---|---|---|
| 2025 | $15,611 | $450,800 | $144,000 | $306,800 |
| 2024 | $15,314 | $450,800 | $144,000 | $306,800 |
Source: Public Records
Map
Nearby Homes
- 193 Jacksonville Dr
- 16 Absecon Rd
- 1 Glenbrook Ct
- 10 Buena Rd
- 560 Allentown Rd
- 72 Allentown Rd
- 581 Allentown Rd
- 121 Harrison Rd
- 7 Madeleine Place
- 132 Camden Rd
- 104 Marmora Rd
- Rockefeller with Library Plan at Parq
- Rockefeller Plan at Parq
- 44 Willow Ln
- 67 Willow Ln
- 17 Willow Ln
- 51 Willow Ln
- 131 Sunrise Dr Unit 1405
- 91 Rhyan Dr
- 34 Templar Way
Your Personal Tour Guide
Ask me questions while you tour the home.