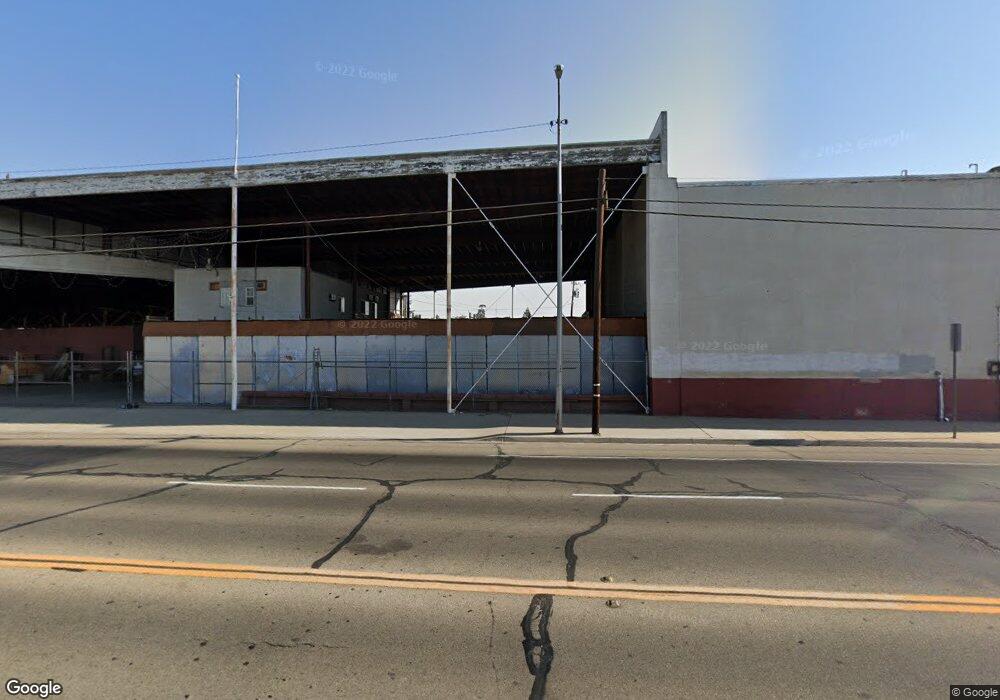
850 I St Reedley, CA 93654
2
Beds
--
Bath
52,748
Sq Ft
1.73
Acres
About This Home
This home is located at 850 I St, Reedley, CA 93654. 850 I St is a home located in Fresno County with nearby schools including Lincoln Elementary School, General Grant Middle School, and Reedley High School.
Ownership History
Date
Name
Owned For
Owner Type
Purchase Details
Closed on
Jul 17, 2018
Sold by
Auyeung Nin Ho and Auyeung Connie Shui Fong
Bought by
Ay Nc Lp
Purchase Details
Closed on
Mar 1, 2018
Sold by
Yeung Ho Nin Au and Yeung Connie Shui Fong Au
Bought by
Ay Nc Lp
Purchase Details
Closed on
Apr 1, 2009
Sold by
Yeung Ho Nin Au and Yeung Connie Shiu Fong Au
Bought by
Auyeung Nin Ho and Auyeung Connie Shui Fong
Purchase Details
Closed on
Mar 2, 2001
Sold by
Imperial Bank
Bought by
Yeung Ho Nin Au and Yeung Connie Shui Fong Au
Home Financials for this Owner
Home Financials are based on the most recent Mortgage that was taken out on this home.
Original Mortgage
$220,000
Interest Rate
7.12%
Mortgage Type
Commercial
Purchase Details
Closed on
Nov 9, 1998
Sold by
Crown American Bank
Bought by
Administrator U S Small Business Adminis
Purchase Details
Closed on
Jul 23, 1998
Sold by
Nakata Family Partnership
Bought by
Crown American Bank
Create a Home Valuation Report for This Property
The Home Valuation Report is an in-depth analysis detailing your home's value as well as a comparison with similar homes in the area
Home Values in the Area
Average Home Value in this Area
Purchase History
| Date | Buyer | Sale Price | Title Company |
|---|---|---|---|
| Ay Nc Lp | -- | None Available | |
| Ay Nc Lp | -- | None Available | |
| Auyeung Nin Ho | -- | None Available | |
| Yeung Ho Nin Au | $340,000 | North American Title | |
| Administrator U S Small Business Adminis | -- | -- | |
| Crown American Bank | $525,000 | American Title Co |
Source: Public Records
Mortgage History
| Date | Status | Borrower | Loan Amount |
|---|---|---|---|
| Previous Owner | Yeung Ho Nin Au | $220,000 |
Source: Public Records
Tax History
| Year | Tax Paid | Tax Assessment Tax Assessment Total Assessment is a certain percentage of the fair market value that is determined by local assessors to be the total taxable value of land and additions on the property. | Land | Improvement |
|---|---|---|---|---|
| 2025 | $5,970 | $512,305 | $226,015 | $286,290 |
| 2023 | $5,844 | $492,414 | $217,240 | $275,174 |
| 2022 | $5,820 | $482,760 | $212,981 | $269,779 |
| 2021 | $5,729 | $473,295 | $208,805 | $264,490 |
| 2020 | $5,746 | $468,442 | $206,664 | $261,778 |
| 2019 | $5,603 | $459,258 | $202,612 | $256,646 |
| 2018 | $5,598 | $450,254 | $198,640 | $251,614 |
| 2017 | $5,329 | $441,427 | $194,746 | $246,681 |
| 2016 | $5,425 | $432,773 | $190,928 | $241,845 |
| 2015 | $5,236 | $426,274 | $188,061 | $238,213 |
| 2014 | $5,234 | $417,925 | $184,378 | $233,547 |
Source: Public Records
Map
Nearby Homes
- 2043 11th St
- 1031 K St
- 471 S Reed Ave
- 2222 11th St
- 394 S Oak Dr
- 1249 D St
- 165 E Linden Ave
- 995 S Hope Ave
- 266 E Linden Ave
- 1175 N Frankwood Ave
- 216 S Sunset Ave
- 864 E Evening Glow Ave
- 17689 E Manning Ave
- 1300 W Olson Ave Unit 61
- 1300 W Olson Ave Unit 179
- 1300 W Olson Ave Unit 131
- 1300 W Olson Ave Unit 97
- 1300 W Olson Ave Unit 52
- 657 W Parlier Ave Unit 107
- 657 W Parlier Ave Unit 106
Your Personal Tour Guide
Ask me questions while you tour the home.