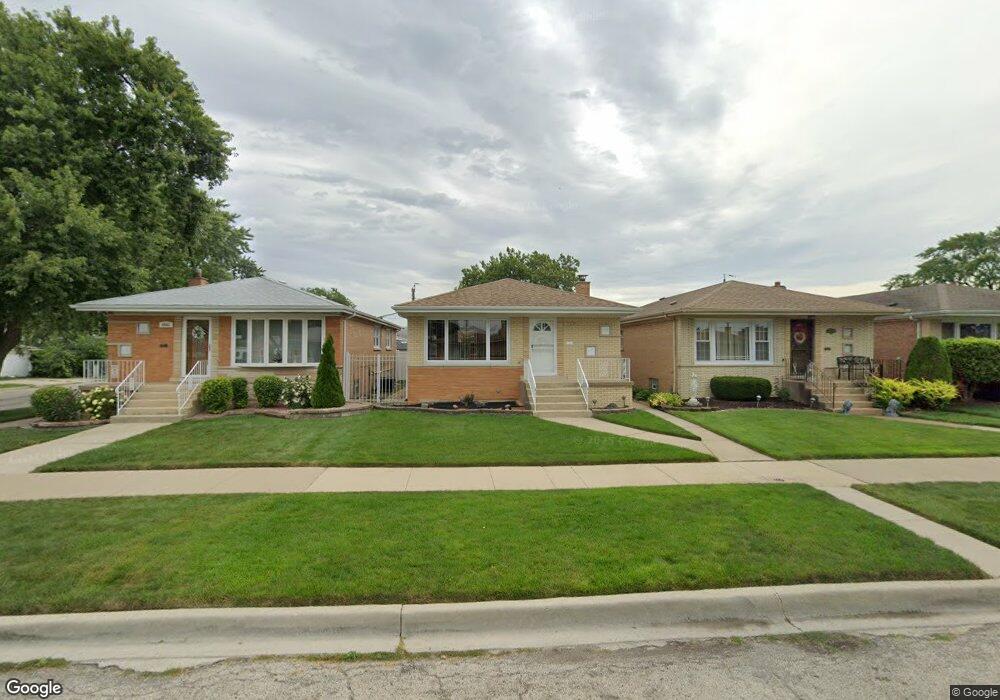
8505 S Kilpatrick Ave Chicago, IL 60652
Scottsdale NeighborhoodEstimated Value: $279,000 - $338,000
3
Beds
1
Bath
1,181
Sq Ft
$261/Sq Ft
Est. Value
About This Home
This home is located at 8505 S Kilpatrick Ave, Chicago, IL 60652 and is currently estimated at $307,733, approximately $260 per square foot. 8505 S Kilpatrick Ave is a home located in Cook County with nearby schools including Durkin Park Elementary School, Bogan Computer Technical High School, and St Bede-Venerable School.
Ownership History
Date
Name
Owned For
Owner Type
Purchase Details
Closed on
Jul 26, 2004
Sold by
Rivas Ernesto and Montes Jose F
Bought by
Rivas Ernesto and Rivas Catalina
Current Estimated Value
Home Financials for this Owner
Home Financials are based on the most recent Mortgage that was taken out on this home.
Original Mortgage
$212,400
Outstanding Balance
$108,803
Interest Rate
6.5%
Mortgage Type
Unknown
Estimated Equity
$198,930
Purchase Details
Closed on
Sep 17, 2002
Sold by
Farrell Thomas E and Farrell Mary E
Bought by
Rivas Ernesto and Montes Jose F
Home Financials for this Owner
Home Financials are based on the most recent Mortgage that was taken out on this home.
Original Mortgage
$184,888
Interest Rate
6.29%
Mortgage Type
FHA
Purchase Details
Closed on
Jun 10, 1996
Sold by
Ferrell Thomas E and Ferrell Mary E
Bought by
Farrell Thomas E and Farrell Mary E
Create a Home Valuation Report for This Property
The Home Valuation Report is an in-depth analysis detailing your home's value as well as a comparison with similar homes in the area
Home Values in the Area
Average Home Value in this Area
Purchase History
| Date | Buyer | Sale Price | Title Company |
|---|---|---|---|
| Rivas Ernesto | -- | Law Title Insurance | |
| Rivas Ernesto | -- | -- | |
| Farrell Thomas E | -- | -- |
Source: Public Records
Mortgage History
| Date | Status | Borrower | Loan Amount |
|---|---|---|---|
| Open | Rivas Ernesto | $212,400 | |
| Closed | Rivas Ernesto | $184,888 |
Source: Public Records
Tax History Compared to Growth
Tax History
| Year | Tax Paid | Tax Assessment Tax Assessment Total Assessment is a certain percentage of the fair market value that is determined by local assessors to be the total taxable value of land and additions on the property. | Land | Improvement |
|---|---|---|---|---|
| 2024 | $3,546 | $26,000 | $2,400 | $23,600 |
| 2023 | $3,436 | $20,000 | $3,400 | $16,600 |
| 2022 | $3,436 | $20,000 | $3,400 | $16,600 |
| 2021 | $3,379 | $20,000 | $3,400 | $16,600 |
| 2020 | $3,281 | $17,703 | $3,400 | $14,303 |
| 2019 | $3,336 | $19,891 | $3,400 | $16,491 |
| 2018 | $3,279 | $19,891 | $3,400 | $16,491 |
| 2017 | $3,185 | $18,034 | $3,000 | $15,034 |
| 2016 | $3,140 | $18,034 | $3,000 | $15,034 |
| 2015 | $2,851 | $18,034 | $3,000 | $15,034 |
| 2014 | $2,221 | $14,422 | $2,800 | $11,622 |
| 2013 | $2,167 | $14,422 | $2,800 | $11,622 |
Source: Public Records
Map
Nearby Homes
- 8534 S Kilpatrick Ave
- 4605 W 84th Place
- 8554 S Keating Ave
- 8618 S Kolmar Ave
- 10810 S Kilpatrick Ave Unit 1NE
- 8454 S Kostner Ave
- 4536 W 83rd St
- 4421 W 87th St
- 8772 S Kolmar Ave
- 8650 Laporte Ave Unit 2B
- 8627 S Kostner Ave
- 8132 S Kilbourn Ave
- 8605 Leclaire Ave
- 8069 S Kolmar Ave
- 8053 S Kenton Ave
- 8737 Sproat Ave Unit 2
- 4327 W 81st St
- 8638 S Keeler Ave
- 8648 S Keeler Ave
- 8001 S Kilpatrick Ave
- 8507 S Kilpatrick Ave
- 8501 S Kilpatrick Ave
- 8515 S Kilpatrick Ave
- 8517 S Kilpatrick Ave
- 8504 S Knox Ave
- 8500 S Knox Ave
- 8508 S Knox Ave
- 8512 S Knox Ave
- 8521 S Kilpatrick Ave
- 4655 W 84th Place
- 4649 W 84th Place
- 8516 S Knox Ave
- 4659 W 84th Place
- 8504 S Kilpatrick Ave
- 4645 W 84th Place
- 8506 S Kilpatrick Ave
- 8523 S Kilpatrick Ave
- 8500 S Kilpatrick Ave
- 8520 S Knox Ave