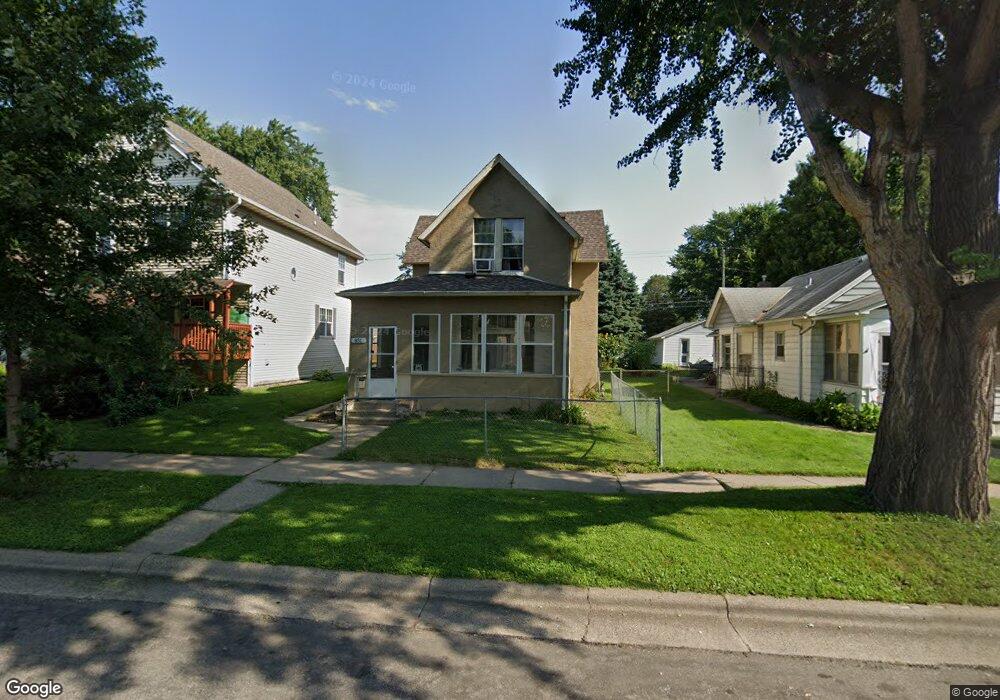
851 851 Sims-Avenue- St. Paul, MN 55106
Payne-Phalen NeighborhoodEstimated Value: $182,000 - $248,000
4
Beds
2
Baths
1,487
Sq Ft
$150/Sq Ft
Est. Value
About This Home
This home is located at 851 851 Sims-Avenue-, St. Paul, MN 55106 and is currently estimated at $223,170, approximately $150 per square foot. 851 851 Sims-Avenue- is a home located in Ramsey County with nearby schools including Frost Lake Elementary School, Txuj Ci HMong Language and Culture Upper Campus, and Johnson Senior High School.
Ownership History
Date
Name
Owned For
Owner Type
Purchase Details
Closed on
Jan 4, 2016
Sold by
Convenant Capital Llc
Bought by
New Direction Ira Inc
Current Estimated Value
Home Financials for this Owner
Home Financials are based on the most recent Mortgage that was taken out on this home.
Original Mortgage
$73,500
Outstanding Balance
$33,899
Interest Rate
6%
Mortgage Type
Seller Take Back
Estimated Equity
$189,271
Purchase Details
Closed on
Jan 30, 2009
Sold by
Gmac Mtg Llc
Bought by
Lee Yia
Purchase Details
Closed on
Aug 29, 1996
Sold by
Kroll Sadie L
Bought by
Lee Teng and Xiong Xia
Create a Home Valuation Report for This Property
The Home Valuation Report is an in-depth analysis detailing your home's value as well as a comparison with similar homes in the area
Home Values in the Area
Average Home Value in this Area
Purchase History
| Date | Buyer | Sale Price | Title Company |
|---|---|---|---|
| New Direction Ira Inc | $105,000 | All American Title Company | |
| Lee Yia | $23,625 | -- | |
| Lee Teng | $59,000 | -- |
Source: Public Records
Mortgage History
| Date | Status | Borrower | Loan Amount |
|---|---|---|---|
| Open | New Direction Ira Inc | $73,500 |
Source: Public Records
Tax History Compared to Growth
Tax History
| Year | Tax Paid | Tax Assessment Tax Assessment Total Assessment is a certain percentage of the fair market value that is determined by local assessors to be the total taxable value of land and additions on the property. | Land | Improvement |
|---|---|---|---|---|
| 2025 | $3,240 | $228,800 | $25,000 | $203,800 |
| 2023 | $3,240 | $196,300 | $20,000 | $176,300 |
| 2022 | $2,958 | $226,700 | $20,000 | $206,700 |
| 2021 | $2,630 | $179,700 | $20,000 | $159,700 |
| 2020 | $2,598 | $155,400 | $7,000 | $148,400 |
| 2019 | $2,210 | $151,600 | $7,000 | $144,600 |
| 2018 | $1,880 | $126,500 | $7,000 | $119,500 |
| 2017 | $2,096 | $110,000 | $7,000 | $103,000 |
| 2016 | $2,256 | $0 | $0 | $0 |
| 2015 | $1,984 | $116,800 | $7,000 | $109,800 |
| 2014 | $1,734 | $0 | $0 | $0 |
Source: Public Records
Map
Nearby Homes