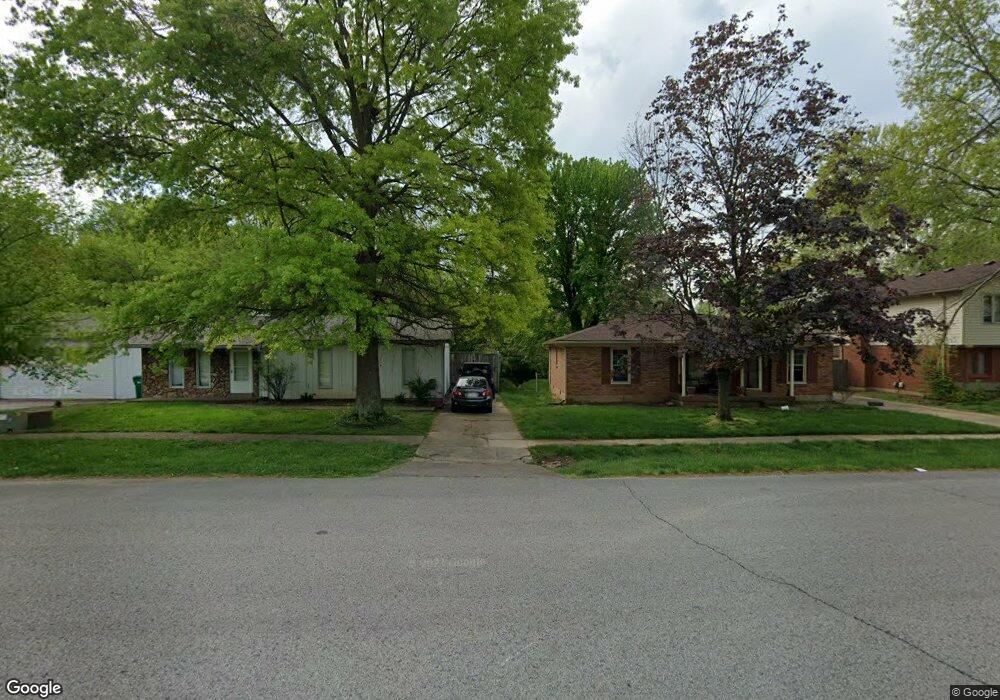
8511 Roseborough Ct Unit 1 Louisville, KY 40228
Highview NeighborhoodEstimated Value: $231,393 - $247,000
3
Beds
2
Baths
1,080
Sq Ft
$222/Sq Ft
Est. Value
About This Home
This home is located at 8511 Roseborough Ct Unit 1, Louisville, KY 40228 and is currently estimated at $239,348, approximately $221 per square foot. 8511 Roseborough Ct Unit 1 is a home located in Jefferson County with nearby schools including Smyrna Elementary School, Hartstern Elementary School, and Luhr Elementary School.
Ownership History
Date
Name
Owned For
Owner Type
Purchase Details
Closed on
Oct 5, 2020
Sold by
Jackson Althea
Bought by
Burrell Joseh B
Current Estimated Value
Home Financials for this Owner
Home Financials are based on the most recent Mortgage that was taken out on this home.
Original Mortgage
$166,920
Outstanding Balance
$148,466
Interest Rate
2.9%
Mortgage Type
FHA
Estimated Equity
$90,882
Purchase Details
Closed on
Jun 1, 2010
Sold by
Greschel John K and Greschel Robin
Bought by
Jackson Althea
Home Financials for this Owner
Home Financials are based on the most recent Mortgage that was taken out on this home.
Original Mortgage
$116,332
Interest Rate
5.25%
Mortgage Type
FHA
Purchase Details
Closed on
Jul 7, 2008
Sold by
Frye Brian W
Bought by
Countrywide Home Loans Inc
Create a Home Valuation Report for This Property
The Home Valuation Report is an in-depth analysis detailing your home's value as well as a comparison with similar homes in the area
Home Values in the Area
Average Home Value in this Area
Purchase History
| Date | Buyer | Sale Price | Title Company |
|---|---|---|---|
| Burrell Joseh B | $170,000 | Kentuckiana Title Agency Llc | |
| Jackson Althea | $117,900 | None Available | |
| Countrywide Home Loans Inc | $124,123 | None Available |
Source: Public Records
Mortgage History
| Date | Status | Borrower | Loan Amount |
|---|---|---|---|
| Open | Burrell Joseh B | $166,920 | |
| Previous Owner | Jackson Althea | $116,332 |
Source: Public Records
Tax History Compared to Growth
Tax History
| Year | Tax Paid | Tax Assessment Tax Assessment Total Assessment is a certain percentage of the fair market value that is determined by local assessors to be the total taxable value of land and additions on the property. | Land | Improvement |
|---|---|---|---|---|
| 2024 | $1,947 | $170,000 | $16,500 | $153,500 |
| 2023 | $2,003 | $170,000 | $16,500 | $153,500 |
| 2022 | $2,009 | $170,000 | $16,500 | $153,500 |
| 2021 | $2,141 | $170,000 | $16,500 | $153,500 |
| 2020 | $1,406 | $118,440 | $22,000 | $96,440 |
| 2019 | $1,284 | $118,440 | $22,000 | $96,440 |
| 2018 | $1,268 | $118,440 | $22,000 | $96,440 |
| 2017 | $1,243 | $118,440 | $22,000 | $96,440 |
| 2013 | $1,179 | $117,900 | $18,400 | $99,500 |
Source: Public Records
Map
Nearby Homes
- 6806 Creedmoor Ct
- 6509 Daverman Ct
- 7100 Alma June Way
- 7505 Astrid Way
- 8814 Old Ironsides Dr
- 8320 Smyrna Pkwy
- 8011 Sherry Lynn Ct
- 9000 John Paul Ct
- 6107 Schreiner Ct
- 8213 Roseborough Rd
- 8208 Roseborough Rd
- 6412 Oak Village Dr
- 8523 Gregory Way
- 9011 Lantana Dr
- 6913 Janes Farm Dr Unit 6913
- 7215 Applegate Ln
- 6818 Oak Rock Dr
- 6816 Oak Rock Dr
- 6812 Oak Rock Dr
- 6802 Oak Rock Dr
- 8511 Roseborough Rd
- 8509 Roseborough Rd
- 8513 Roseborough Rd
- 8507 Roseborough Rd
- 8418 Cloverport Dr
- 8515 Roseborough Rd
- 6903 Catalpa Springs Dr
- 8505 Roseborough Rd
- 8417 Cloverport Dr
- 8508 Roseborough Rd
- 8416 Cloverport Dr
- 8503 Roseborough Rd
- 8502 Roseborough Rd
- 6905 Catalpa Springs Dr
- 8517 Roseborough Rd
- 8415 Cloverport Dr
- 6901 Catalpa Springs Dr
- 8414 Cloverport Dr
- 8501 Roseborough Rd
- 6814 Creedmoor Ct