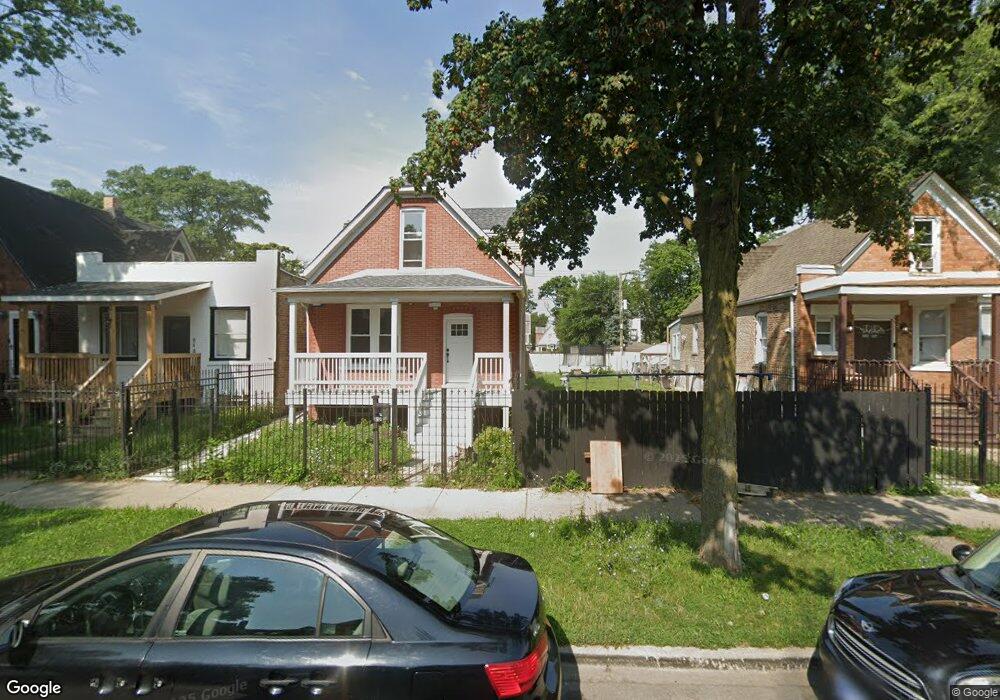
852 N Trumbull Ave Chicago, IL 60651
Humboldt Park NeighborhoodEstimated Value: $188,000 - $273,304
4
Beds
1
Bath
1,104
Sq Ft
$203/Sq Ft
Est. Value
About This Home
This home is located at 852 N Trumbull Ave, Chicago, IL 60651 and is currently estimated at $223,576, approximately $202 per square foot. 852 N Trumbull Ave is a home located in Cook County with nearby schools including Orr Academy High School, Polaris Elementary Charter Academy, and Rowe-Clark Math & Science Academy.
Ownership History
Date
Name
Owned For
Owner Type
Purchase Details
Closed on
May 8, 2024
Sold by
Boduch Jolanta and Boduch Edmund
Bought by
Quintana Maria Narcisa
Current Estimated Value
Purchase Details
Closed on
Dec 28, 2014
Sold by
Bbb Ventures Llc
Bought by
Boduch Jolanta and Boduch Edmund
Purchase Details
Closed on
Apr 27, 2009
Sold by
Wells Fargo Bank Na
Bought by
Bbb Ventures Llc
Purchase Details
Closed on
Jul 15, 2008
Sold by
Denton Lashun
Bought by
Wells Fargo Bank Minnesota Na and Structured Asset Securities Corp Amortiz
Purchase Details
Closed on
Mar 23, 2001
Sold by
Davis Michael
Bought by
Denton Lashun
Purchase Details
Closed on
Jun 9, 2000
Sold by
Cross Kecia
Bought by
Davis Michael
Home Financials for this Owner
Home Financials are based on the most recent Mortgage that was taken out on this home.
Original Mortgage
$72,000
Interest Rate
11.4%
Create a Home Valuation Report for This Property
The Home Valuation Report is an in-depth analysis detailing your home's value as well as a comparison with similar homes in the area
Home Values in the Area
Average Home Value in this Area
Purchase History
| Date | Buyer | Sale Price | Title Company |
|---|---|---|---|
| Quintana Maria Narcisa | $110,000 | Saturn Title | |
| Boduch Jolanta | -- | None Available | |
| Bbb Ventures Llc | $8,000 | None Available | |
| Wells Fargo Bank Minnesota Na | -- | None Available | |
| Denton Lashun | $120,000 | Heritage Title Company | |
| Davis Michael | $80,000 | Chicago Title Insurance Co |
Source: Public Records
Mortgage History
| Date | Status | Borrower | Loan Amount |
|---|---|---|---|
| Previous Owner | Davis Michael | $72,000 |
Source: Public Records
Tax History
| Year | Tax Paid | Tax Assessment Tax Assessment Total Assessment is a certain percentage of the fair market value that is determined by local assessors to be the total taxable value of land and additions on the property. | Land | Improvement |
|---|---|---|---|---|
| 2025 | $2,554 | $17,200 | $5,781 | $11,419 |
| 2024 | $2,554 | $17,200 | $5,781 | $11,419 |
| 2023 | $2,461 | $15,387 | $4,688 | $10,699 |
| 2022 | $2,461 | $15,387 | $4,688 | $10,699 |
| 2021 | $2,424 | $15,385 | $4,687 | $10,698 |
| 2020 | $1,909 | $11,670 | $3,671 | $7,999 |
| 2019 | $1,916 | $12,967 | $3,671 | $9,296 |
| 2018 | $2,251 | $14,831 | $3,671 | $11,160 |
| 2017 | $1,643 | $11,009 | $3,281 | $7,728 |
| 2016 | $1,705 | $11,009 | $3,281 | $7,728 |
| 2015 | $1,738 | $12,108 | $3,281 | $8,827 |
| 2014 | $2,173 | $11,714 | $3,125 | $8,589 |
| 2013 | $2,130 | $11,714 | $3,125 | $8,589 |
Source: Public Records
Map
Nearby Homes
- 905 N Saint Louis Ave
- 854 N Saint Louis Ave
- 903 N Drake Ave
- 3447 W Chicago Ave
- 937 N Saint Louis Ave
- 3347 W Iowa St
- 742 N Trumbull Ave
- 921 N Drake Ave
- 741 N Trumbull Ave
- 951 N Trumbull Ave
- 948 N Homan Ave
- 3546 W Chicago Ave
- 717 N Homan Ave
- 943 N Central Park Ave
- 1023 N Saint Louis Ave
- 650 N Homan Ave
- 820 N Monticello Ave
- 644 N Trumbull Ave
- 646 N Homan Ave
- 656 N Drake Ave
- 848 N Trumbull Ave
- 846 N Trumbull Ave
- 844 N Trumbull Ave
- 854 N Trumbull Ave
- 842 N Trumbull Ave
- 856 N Trumbull Ave
- 838 N Trumbull Ave
- 836 N Trumbull Ave
- 847 N Saint Louis Ave
- 853 N Saint Louis Ave
- 845 N Saint Louis Ave
- 855 N Saint Louis Ave
- 834 N Trumbull Ave
- 857 N Saint Louis Ave
- 839 N Saint Louis Ave
- 832 N Trumbull Ave
- 855 N Trumbull Ave
- 843 N St Louis Ave
- 837 N Saint Louis Ave
- 851 N Trumbull Ave
Your Personal Tour Guide
Ask me questions while you tour the home.