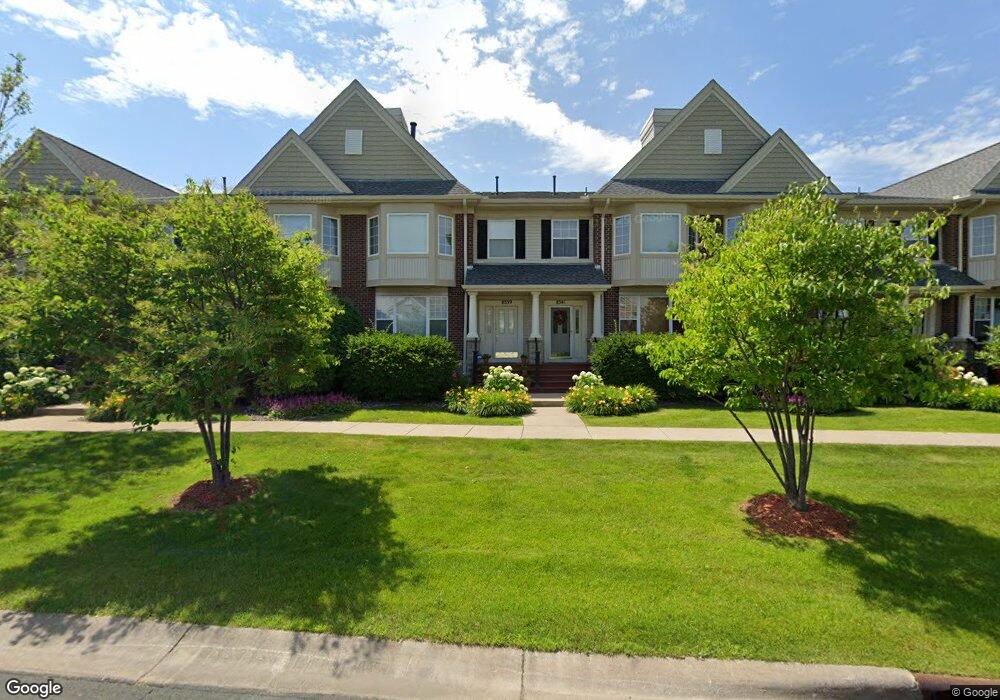
8529 Forestview Ln N Maple Grove, MN 55369
Estimated Value: $311,000 - $328,000
2
Beds
3
Baths
1,684
Sq Ft
$189/Sq Ft
Est. Value
About This Home
This home is located at 8529 Forestview Ln N, Maple Grove, MN 55369 and is currently estimated at $318,385, approximately $189 per square foot. 8529 Forestview Ln N is a home located in Hennepin County with nearby schools including Rice Lake Elementary School, Maple Grove Middle School, and Maple Grove Senior High School.
Ownership History
Date
Name
Owned For
Owner Type
Purchase Details
Closed on
Apr 29, 2013
Sold by
Ingeman Lindsey Rose
Bought by
Rowan Anna K
Current Estimated Value
Home Financials for this Owner
Home Financials are based on the most recent Mortgage that was taken out on this home.
Original Mortgage
$77,500
Outstanding Balance
$54,670
Interest Rate
3.38%
Mortgage Type
New Conventional
Estimated Equity
$263,715
Purchase Details
Closed on
Aug 25, 2009
Sold by
Chang Johnny W
Bought by
Groder Lucas and Ingeman Lindsey
Purchase Details
Closed on
Jun 9, 2005
Sold by
Rocheleau Justin B
Bought by
Chang Johnny W and Not Provided
Purchase Details
Closed on
Mar 29, 2002
Sold by
The Rottlund Co
Bought by
Rocheleau Justin B and Rocheleau Jamie J
Purchase Details
Closed on
Mar 25, 2002
Sold by
Tradition Development Llc
Bought by
The Rottlund Company Inc
Create a Home Valuation Report for This Property
The Home Valuation Report is an in-depth analysis detailing your home's value as well as a comparison with similar homes in the area
Home Values in the Area
Average Home Value in this Area
Purchase History
| Date | Buyer | Sale Price | Title Company |
|---|---|---|---|
| Rowan Anna K | $186,838 | Burnet Title | |
| Ingeman Lindsey Rose | -- | Burnet Title | |
| Groder Lucas | $183,000 | -- | |
| Chang Johnny W | $228,000 | -- | |
| Rocheleau Justin B | $199,900 | -- | |
| The Rottlund Company Inc | $5,225 | -- |
Source: Public Records
Mortgage History
| Date | Status | Borrower | Loan Amount |
|---|---|---|---|
| Open | Rowan Anna K | $77,500 |
Source: Public Records
Tax History Compared to Growth
Tax History
| Year | Tax Paid | Tax Assessment Tax Assessment Total Assessment is a certain percentage of the fair market value that is determined by local assessors to be the total taxable value of land and additions on the property. | Land | Improvement |
|---|---|---|---|---|
| 2024 | $3,311 | $287,900 | $59,500 | $228,400 |
| 2023 | $3,395 | $297,400 | $64,600 | $232,800 |
| 2022 | $2,861 | $294,400 | $49,300 | $245,100 |
| 2021 | $2,630 | $247,600 | $32,000 | $215,600 |
| 2020 | $2,918 | $225,500 | $30,800 | $194,700 |
| 2019 | $2,691 | $237,300 | $43,600 | $193,700 |
| 2018 | $2,679 | $210,000 | $30,500 | $179,500 |
| 2017 | $2,544 | $190,200 | $34,000 | $156,200 |
| 2016 | $2,484 | $184,000 | $36,000 | $148,000 |
| 2015 | $2,425 | $175,900 | $37,000 | $138,900 |
| 2014 | -- | $161,500 | $37,000 | $124,500 |
Source: Public Records
Map
Nearby Homes
- 11879 85th Place N Unit 54
- 11712 84th Ave N Unit 309
- 8406 Jonquil Ln N
- 11631 88th Ave N
- 11537 88th Ave N
- 8704 Cottonwood Ln N
- 11760 88th Place N
- 11601 82nd Ave N
- 8864 Cottonwood Ln N
- 11540 81st Place N
- 11462 81st Place N
- 12598 84th Place N
- 12509 88th Ave N
- 8154 Arrowwood Ln N
- 9058 Goldenrod Ln N
- 8326 Oakview Ct N
- 14877 106th Ave N
- 12775 82nd Place N
- 9132 Kirkwood Ln N
- 8949 Rosewood Ln N
- 8527 8527 Forestview-Lane-n
- 8525 8525 Forestview-Lane-n
- 8517 8517 Forestview-Lane-n
- 8519 8519 Forestview Ln N
- 8529 8529 Forestview Ln N
- 8515 8515 Forestview-Lane-n
- 8523 8523 Forestview-Lane-n
- 8527 8527 Forestview Ln N
- 8525 8525 Forestview Ln N
- 8547 8547 Forestview Ln N
- 8549 8549 Forestview-Lane-n
- 8529 8529 Forestview-Lane-n
- 8511 8511 Forestview Ln N
- 8535 8535 Forestview Ln N
- 8515 8515 Forestview Ln N
- 8541 8541 Forestview Ln N
- 8523 8523 Forestview Ln N
- 8549 Forestview Ln N Unit 60
- 8541 Forestview Ln N Unit 56
- 8537 Forestview Ln N