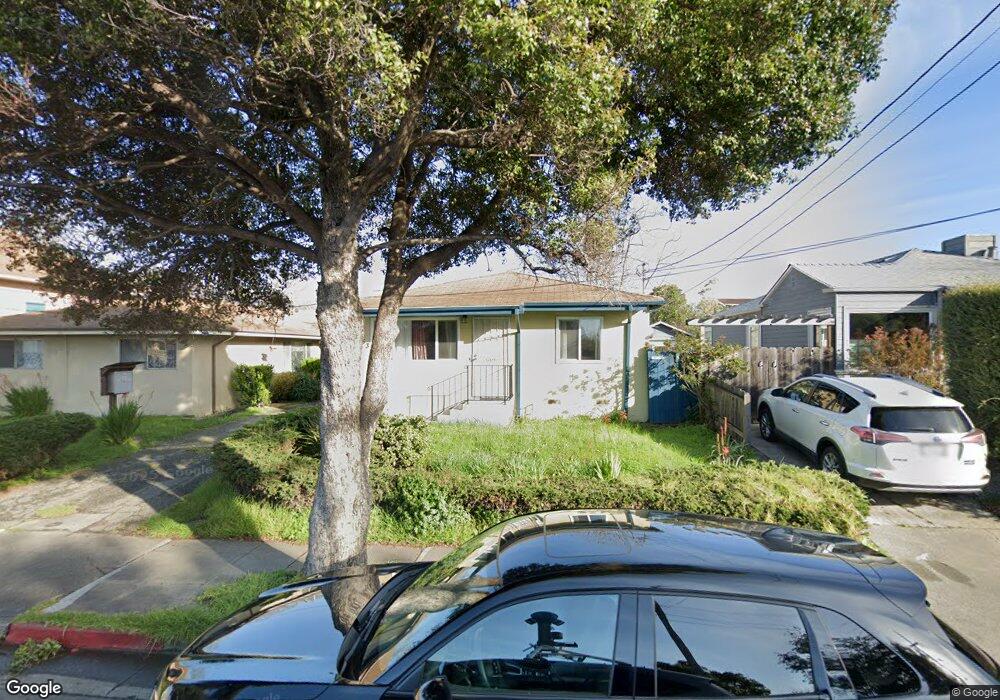
853 Cedar St Berkeley, CA 94710
West Berkeley NeighborhoodEstimated Value: $895,000 - $1,372,000
7
Beds
4
Baths
2,455
Sq Ft
$464/Sq Ft
Est. Value
About This Home
This home is located at 853 Cedar St, Berkeley, CA 94710 and is currently estimated at $1,139,311, approximately $464 per square foot. 853 Cedar St is a home located in Alameda County with nearby schools including Rosa Parks Elementary School, Ruth Acty Elementary, and Berkeley Arts Magnet at Whittier School.
Ownership History
Date
Name
Owned For
Owner Type
Purchase Details
Closed on
Sep 8, 2008
Sold by
Randhawa Pritam K and Pritam Randhawa Survivors Trus
Bought by
Randhawa Amrik S
Current Estimated Value
Purchase Details
Closed on
Sep 18, 2000
Sold by
Randhawa Mohan and Randhawa Pritam Kaur
Bought by
Randhawa Mohan S and Randhawa Pritam K
Purchase Details
Closed on
Aug 18, 1994
Sold by
Merkel Jack R and Ruster Bert E
Bought by
Randhawa Mohan and Randhawa Pritam Kaur
Home Financials for this Owner
Home Financials are based on the most recent Mortgage that was taken out on this home.
Original Mortgage
$189,375
Interest Rate
8.73%
Create a Home Valuation Report for This Property
The Home Valuation Report is an in-depth analysis detailing your home's value as well as a comparison with similar homes in the area
Home Values in the Area
Average Home Value in this Area
Purchase History
| Date | Buyer | Sale Price | Title Company |
|---|---|---|---|
| Randhawa Amrik S | -- | None Available | |
| Randhawa Pritam K | -- | None Available | |
| Randhawa Amrik S | -- | None Available | |
| Randhawa Pritam K | -- | None Available | |
| Randhawa Mohan S | -- | -- | |
| Randhawa Mohan | $252,500 | First American Title Guarant |
Source: Public Records
Mortgage History
| Date | Status | Borrower | Loan Amount |
|---|---|---|---|
| Previous Owner | Randhawa Mohan | $189,375 | |
| Closed | Randhawa Mohan | $25,250 |
Source: Public Records
Tax History
| Year | Tax Paid | Tax Assessment Tax Assessment Total Assessment is a certain percentage of the fair market value that is determined by local assessors to be the total taxable value of land and additions on the property. | Land | Improvement |
|---|---|---|---|---|
| 2025 | $9,585 | $424,101 | $127,314 | $296,787 |
| 2024 | $9,585 | $415,786 | $124,818 | $290,968 |
| 2023 | $9,352 | $407,635 | $122,371 | $285,264 |
| 2022 | $9,111 | $399,643 | $119,972 | $279,671 |
| 2021 | $9,071 | $391,808 | $117,620 | $274,188 |
| 2020 | $8,416 | $387,791 | $116,414 | $271,377 |
| 2019 | $7,899 | $380,189 | $114,132 | $266,057 |
| 2018 | $7,734 | $372,735 | $111,894 | $260,841 |
| 2017 | $7,429 | $365,427 | $109,700 | $255,727 |
| 2016 | $7,068 | $358,264 | $107,550 | $250,714 |
| 2015 | $6,956 | $352,883 | $105,935 | $246,948 |
| 2014 | $6,988 | $345,972 | $103,860 | $242,112 |
Source: Public Records
Map
Nearby Homes
- 817 Jones St
- 921 Jones St
- 995 Virginia St
- 817 Delaware St
- 1450 Fourth St Unit 5
- 940 Delaware St
- 0 Camelia St Unit 41104882
- 1128 Delaware St
- 1339 Kains Ave
- 2013 9th St
- 1728 Curtis St
- 1631 Belvedere Ave
- 1400 Santa fe Ave
- 1919 Curtis St
- 1234 Stannage Ave
- 1213 San Pablo Ave
- 1050 Allston Way
- 1261 Hearst Ave
- 1322 Virginia St
- 2220 7th St
Your Personal Tour Guide
Ask me questions while you tour the home.