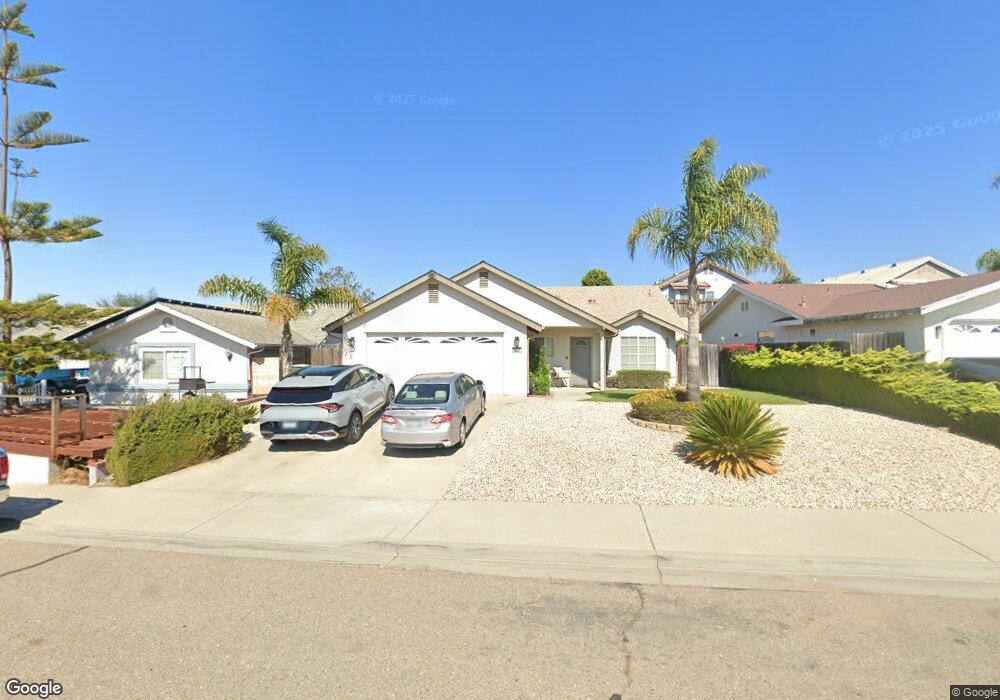
853 Jessica Place Nipomo, CA 93444
Estimated Value: $653,536 - $703,000
3
Beds
2
Baths
1,427
Sq Ft
$478/Sq Ft
Est. Value
About This Home
This home is located at 853 Jessica Place, Nipomo, CA 93444 and is currently estimated at $682,634, approximately $478 per square foot. 853 Jessica Place is a home located in San Luis Obispo County with nearby schools including Dorothea Lange Elementary School, Mesa Middle School, and Nipomo High School.
Ownership History
Date
Name
Owned For
Owner Type
Purchase Details
Closed on
Nov 17, 2004
Sold by
Houston Loretta L
Bought by
Houston Loretta L
Current Estimated Value
Purchase Details
Closed on
Apr 5, 2002
Sold by
Moore Kyleen
Bought by
Houston Loretta L
Home Financials for this Owner
Home Financials are based on the most recent Mortgage that was taken out on this home.
Original Mortgage
$165,000
Outstanding Balance
$68,107
Interest Rate
6.75%
Estimated Equity
$614,527
Purchase Details
Closed on
Jul 18, 2000
Sold by
American Financial & Investment Corp
Bought by
Moore Kyleen
Home Financials for this Owner
Home Financials are based on the most recent Mortgage that was taken out on this home.
Original Mortgage
$175,500
Interest Rate
8.2%
Purchase Details
Closed on
Mar 4, 1996
Sold by
Andys Lp
Bought by
American Financial & Investment Corp
Home Financials for this Owner
Home Financials are based on the most recent Mortgage that was taken out on this home.
Original Mortgage
$95,000
Interest Rate
7.01%
Create a Home Valuation Report for This Property
The Home Valuation Report is an in-depth analysis detailing your home's value as well as a comparison with similar homes in the area
Home Values in the Area
Average Home Value in this Area
Purchase History
| Date | Buyer | Sale Price | Title Company |
|---|---|---|---|
| Houston Loretta L | -- | -- | |
| Houston Loretta L | $254,000 | Fidelity Title Company | |
| Moore Kyleen | $195,000 | Chicago Title Co | |
| American Financial & Investment Corp | $57,500 | First American Title Ins Co |
Source: Public Records
Mortgage History
| Date | Status | Borrower | Loan Amount |
|---|---|---|---|
| Open | Houston Loretta L | $165,000 | |
| Previous Owner | Moore Kyleen | $175,500 | |
| Previous Owner | American Financial & Investment Corp | $95,000 | |
| Closed | American Financial & Investment Corp | $32,500 |
Source: Public Records
Tax History Compared to Growth
Tax History
| Year | Tax Paid | Tax Assessment Tax Assessment Total Assessment is a certain percentage of the fair market value that is determined by local assessors to be the total taxable value of land and additions on the property. | Land | Improvement |
|---|---|---|---|---|
| 2025 | $3,877 | $375,212 | $132,943 | $242,269 |
| 2024 | $3,833 | $367,856 | $130,337 | $237,519 |
| 2023 | $3,833 | $360,644 | $127,782 | $232,862 |
| 2022 | $3,776 | $353,574 | $125,277 | $228,297 |
| 2021 | $3,769 | $346,642 | $122,821 | $223,821 |
| 2020 | $3,726 | $343,088 | $121,562 | $221,526 |
| 2019 | $3,703 | $336,362 | $119,179 | $217,183 |
| 2018 | $3,659 | $329,768 | $116,843 | $212,925 |
| 2017 | $3,591 | $323,302 | $114,552 | $208,750 |
| 2016 | $3,388 | $316,963 | $112,306 | $204,657 |
| 2015 | $3,340 | $312,203 | $110,620 | $201,583 |
| 2014 | $3,216 | $306,089 | $108,454 | $197,635 |
Source: Public Records
Map
Nearby Homes
- 840 Story St
- 522 Higos Way
- 945 Jeanette Ln
- 457 Polaris Dr
- 725 Monarch Ln
- 483 Violet Ave
- 426 Polaris Dr
- 1127 Starlite Dr
- 393 Uranus Ct
- 468 Neptune Dr
- 1180 Starlite Dr
- 261 Hazel Ln
- 626 Juno Ct
- 232 Scarlett Cir
- 368 Avenida de Amigos
- 450 Avenida de Socios Unit 12
- Mesa Plan at Hill Street Terraces - Hill Street Series
- Pacific Plan at Hill Street Terraces - Hill Street Series
- Monarch Plan at Hill Street Terraces - Hill Street Series
- Rancho Plan at Hill Street Terraces - Hill Street Series
- 847 Jessica Place
- 859 Jessica Place
- 854 Rosana Place
- 860 Rosana Place
- 848 Rosana Place
- 841 Jessica Place
- 866 Rosana Place
- 848 Jessica Place
- 842 Rosana Place
- 860 Jessica Place
- 842 Jessica Place
- 835 Jessica Place
- 861 Rosana Place
- 836 Rosana Place
- 836 Jessica Place
- 525 Los Gallos Ct
- 526 Los Gallos Ct
- 829 Jessica Place