Estimated Value: $526,824 - $589,000
2
Beds
1
Bath
827
Sq Ft
$680/Sq Ft
Est. Value
About This Home
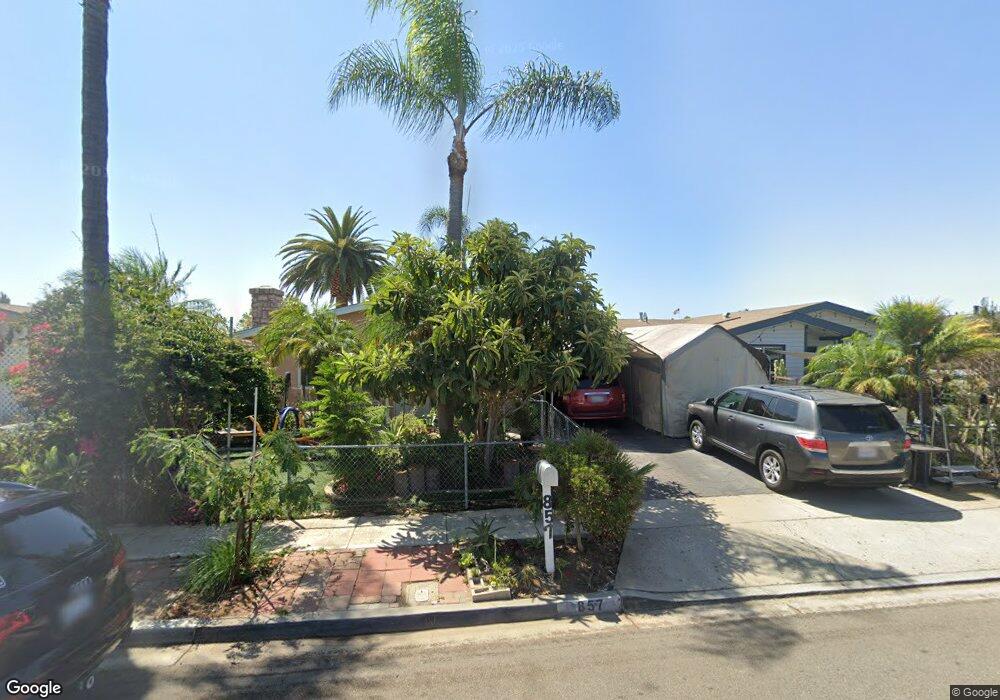
This home is located at 853 Via Felicidad, Vista, CA 92084 and is currently estimated at $562,456, approximately $680 per square foot. 853 Via Felicidad is a home located in San Diego County with nearby schools including Mission Meadows Elementary School, Roosevelt Middle School, and Vista High School.
Ownership History
Date
Name
Owned For
Owner Type
Purchase Details
Closed on
Feb 13, 2009
Sold by
Michael Albert and Michael Sylvia Veronica De Casas
Bought by
Lujano Gilbert and Lujano Candy
Current Estimated Value
Purchase Details
Closed on
Sep 3, 2001
Sold by
Greeman Tobi K
Bought by
Michael Albert and Michel Sylvia Veronica Decasas
Home Financials for this Owner
Home Financials are based on the most recent Mortgage that was taken out on this home.
Original Mortgage
$156,750
Interest Rate
6.91%
Purchase Details
Closed on
Dec 14, 1998
Sold by
Kirk Michael A and Kirk Monta L
Bought by
Greeman Tobi K
Home Financials for this Owner
Home Financials are based on the most recent Mortgage that was taken out on this home.
Original Mortgage
$90,200
Interest Rate
6.73%
Purchase Details
Closed on
Sep 22, 1987
Create a Home Valuation Report for This Property
The Home Valuation Report is an in-depth analysis detailing your home's value as well as a comparison with similar homes in the area
Home Values in the Area
Average Home Value in this Area
Purchase History
| Date | Buyer | Sale Price | Title Company |
|---|---|---|---|
| Lujano Gilbert | $128,000 | Stewart Title Of California | |
| Michael Albert | $165,000 | Chicago Title Co | |
| Greeman Tobi K | $93,000 | Fidelity National Title | |
| -- | $66,000 | -- |
Source: Public Records
Mortgage History
| Date | Status | Borrower | Loan Amount |
|---|---|---|---|
| Previous Owner | Michael Albert | $156,750 | |
| Previous Owner | Greeman Tobi K | $90,200 |
Source: Public Records
Tax History Compared to Growth
Tax History
| Year | Tax Paid | Tax Assessment Tax Assessment Total Assessment is a certain percentage of the fair market value that is determined by local assessors to be the total taxable value of land and additions on the property. | Land | Improvement |
|---|---|---|---|---|
| 2025 | $2,528 | $164,816 | $77,258 | $87,558 |
| 2024 | $2,528 | $161,586 | $75,744 | $85,842 |
| 2023 | $2,485 | $158,418 | $74,259 | $84,159 |
| 2022 | $2,480 | $155,312 | $72,803 | $82,509 |
| 2021 | $2,427 | $152,268 | $71,376 | $80,892 |
| 2020 | $2,408 | $150,708 | $70,645 | $80,063 |
| 2019 | $2,377 | $147,754 | $69,260 | $78,494 |
| 2018 | $2,295 | $144,857 | $67,902 | $76,955 |
| 2017 | $122 | $142,018 | $66,571 | $75,447 |
| 2016 | $2,214 | $139,234 | $65,266 | $73,968 |
| 2015 | $2,198 | $137,143 | $64,286 | $72,857 |
| 2014 | $2,150 | $134,457 | $63,027 | $71,430 |
Source: Public Records
Map
Nearby Homes
- 1501 Anza Ave Unit 39
- 1501 Anza Ave Unit 3
- 1501 Anza Ave Unit 5
- 1501 Anza Ave Unit 72
- 1501 Anza Ave Unit 79
- 1600 E Vista Way Unit 23
- 1600 E Vista Way Unit 103
- 1600 E Vista Way Unit 110
- 1600 E Vista Way Unit 128
- 1600 E Vista Way Unit 51
- 1600 E Vista Way Unit 38
- 1600 E Vista Way Unit 81
- 737 Nob Cir
- 1010 E Bobier Dr Unit 12
- 1010 E Bobier Dr Unit SPC 81
- 1010 E Bobier Dr Unit 44
- 1010 E Bobier Dr Unit Space 51
- 1010 E Bobier Dr Unit 112
- 1010 E Bobier Dr Unit 59
- 1010 E Bobier Dr Unit 137
- 857 Via Felicidad
- 849 Via Felicidad
- 845 Via Felicidad
- 863 Via Felicidad
- 867 Via Felicidad
- 854 Via Felicidad
- 858 Via Felicidad
- 837 Via Felicidad
- 841 Via Felicidad
- 864 Via Felicidad
- 868 Via Felicidad
- 842 Via Felicidad
- 871 Via Felicidad
- 875 Via Felicidad
- 838 Via Felicidad
- 1607 Calle Colorado
- 833 Via Felicidad
- 1608 Calle Bienvenido
- 879 Via Felicidad
- 1611 Calle Colorado