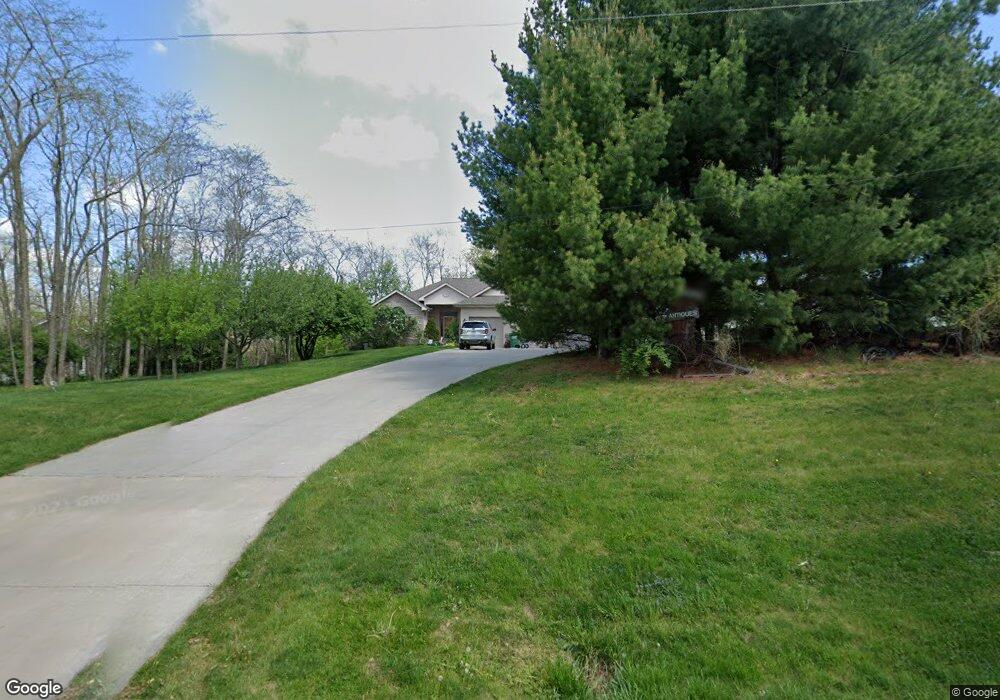
8538 SE 13th Ave Runnells, IA 50237
Estimated Value: $537,000 - $630,165
4
Beds
3
Baths
1,600
Sq Ft
$356/Sq Ft
Est. Value
About This Home
This home is located at 8538 SE 13th Ave, Runnells, IA 50237 and is currently estimated at $569,041, approximately $355 per square foot. 8538 SE 13th Ave is a home located in Polk County with nearby schools including Runnells Elementary School, Southeast Polk Spring Creek- 6th Grade, and Southeast Polk Junior High School.
Ownership History
Date
Name
Owned For
Owner Type
Purchase Details
Closed on
Mar 24, 2010
Sold by
Federal Home Loan Mortgage Corporation
Bought by
Hemingson Byron and Hemingson Judy
Current Estimated Value
Home Financials for this Owner
Home Financials are based on the most recent Mortgage that was taken out on this home.
Original Mortgage
$207,000
Outstanding Balance
$126,699
Interest Rate
3.5%
Mortgage Type
New Conventional
Estimated Equity
$442,342
Purchase Details
Closed on
Jan 13, 2010
Sold by
Us Bank Na
Bought by
Federal Home Loan Mortgage Corp
Purchase Details
Closed on
Jan 7, 2010
Sold by
Johnson Todd A and Johnson Sally J
Bought by
Us Bank Na
Purchase Details
Closed on
Jun 5, 2006
Sold by
Walkup Merrill L and Walkup Sharyll E
Bought by
Johnson Todd Andrew and Johnson Sally J
Home Financials for this Owner
Home Financials are based on the most recent Mortgage that was taken out on this home.
Original Mortgage
$240,000
Interest Rate
6.68%
Mortgage Type
Construction
Create a Home Valuation Report for This Property
The Home Valuation Report is an in-depth analysis detailing your home's value as well as a comparison with similar homes in the area
Home Values in the Area
Average Home Value in this Area
Purchase History
| Date | Buyer | Sale Price | Title Company |
|---|---|---|---|
| Hemingson Byron | -- | Service Link | |
| Federal Home Loan Mortgage Corp | $260,500 | None Available | |
| Us Bank Na | $260,669 | None Available | |
| Johnson Todd Andrew | $49,500 | None Available |
Source: Public Records
Mortgage History
| Date | Status | Borrower | Loan Amount |
|---|---|---|---|
| Open | Hemingson Byron | $207,000 | |
| Previous Owner | Johnson Todd Andrew | $240,000 |
Source: Public Records
Tax History Compared to Growth
Tax History
| Year | Tax Paid | Tax Assessment Tax Assessment Total Assessment is a certain percentage of the fair market value that is determined by local assessors to be the total taxable value of land and additions on the property. | Land | Improvement |
|---|---|---|---|---|
| 2025 | $7,556 | $594,900 | $97,600 | $497,300 |
| 2024 | $7,556 | $533,600 | $85,900 | $447,700 |
| 2023 | $7,204 | $533,600 | $85,900 | $447,700 |
| 2022 | $7,110 | $422,600 | $71,400 | $351,200 |
| 2021 | $6,688 | $422,600 | $71,400 | $351,200 |
| 2020 | $6,592 | $377,800 | $63,700 | $314,100 |
| 2019 | $6,246 | $377,800 | $63,700 | $314,100 |
| 2018 | $6,276 | $344,000 | $56,200 | $287,800 |
| 2017 | $6,212 | $344,000 | $56,200 | $287,800 |
| 2016 | $6,204 | $305,900 | $45,500 | $260,400 |
| 2015 | $6,204 | $305,900 | $45,500 | $260,400 |
| 2014 | $5,902 | $285,600 | $41,700 | $243,900 |
Source: Public Records
Map
Nearby Homes
- 2496 SE 83rd Ct
- 5792 Arbor Hills Ct
- 5736 Arbor Hills Ct
- 5766 Arbor Springs Dr
- 2511 SE 82nd St
- 3356 SE 82nd St
- 7740 Spring Creek Dr
- 3350 SE 82nd St
- 7046 SE 7th Ave
- 7295 SE Vandalia Dr
- 6922 SE 7th Ave
- 6918 SE 7th Ave
- 1200 Arbor Woods Dr
- 1230 Arbor Woods Dr
- 6806 SE 7th Ave
- 6802 SE 7th Ave
- 625 NE 72nd St
- 3320 SE 96th St
- 3380 SE 96th St
- 624 NE 71st St
- 8518 SE 13th Ave
- 8576 SE 13th Ave
- 8496 SE 13th Ave
- 8567 SE 13th Ave
- 8466 SE 13th Ave
- 8613 SE 13th Ave
- 8424 SE 13th Ave
- 8472 SE 13th Ave
- 8677 SE 13th Ave
- 8387 SE 13th Ave
- 8701 SE 13th Ave
- 8355 SE 13th Ave
- 8725 SE 13th Ave
- 8751 SE 13th Ave
- 8315 SE 13th Ave
- 1595 SE 82nd St
- 8283 SE 13th Ave
- 1420 SE 88th St
- 1448 SE 88th St
- 1619 SE 88th St