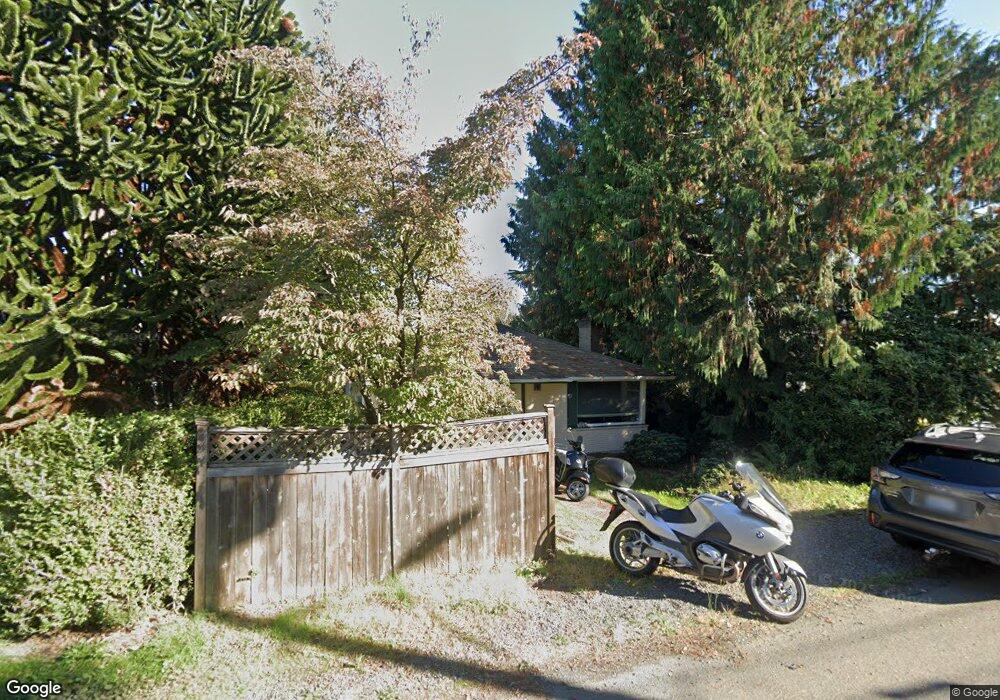
8542 19th Ave NW Seattle, WA 98117
Crown Hill NeighborhoodEstimated Value: $700,000 - $937,000
2
Beds
1
Bath
940
Sq Ft
$904/Sq Ft
Est. Value
About This Home
This home is located at 8542 19th Ave NW, Seattle, WA 98117 and is currently estimated at $850,083, approximately $904 per square foot. 8542 19th Ave NW is a home located in King County with nearby schools including North Beach Elementary School, Whitman Middle School, and Ingraham High School.
Ownership History
Date
Name
Owned For
Owner Type
Purchase Details
Closed on
Jan 25, 2000
Sold by
Lien Joy Hunter
Bought by
Lien Daniel B
Current Estimated Value
Purchase Details
Closed on
Nov 22, 1999
Sold by
Lien Calvin L and Lien Patricia B
Bought by
Lien Daniel B
Purchase Details
Closed on
Nov 15, 1996
Sold by
Cruikshank David M and Piwenitzky Hans H
Bought by
Lien Daniel B and Lien Joy Hunter
Home Financials for this Owner
Home Financials are based on the most recent Mortgage that was taken out on this home.
Original Mortgage
$143,100
Interest Rate
7.88%
Purchase Details
Closed on
Oct 4, 1993
Sold by
Merritt Gordon J and Merritt Carolyn A
Bought by
Cruikshank David M and Piwenitzky Hans H
Home Financials for this Owner
Home Financials are based on the most recent Mortgage that was taken out on this home.
Original Mortgage
$128,250
Interest Rate
6.98%
Purchase Details
Closed on
Aug 31, 1977
Sold by
Butcher K M and Butcher Anna
Bought by
Shonkwiler Arthur K
Create a Home Valuation Report for This Property
The Home Valuation Report is an in-depth analysis detailing your home's value as well as a comparison with similar homes in the area
Home Values in the Area
Average Home Value in this Area
Purchase History
| Date | Buyer | Sale Price | Title Company |
|---|---|---|---|
| Lien Daniel B | -- | First American | |
| Lien Daniel B | -- | First American | |
| Lien Daniel B | $159,000 | Fidelity National Title | |
| Cruikshank David M | $142,500 | First American Title | |
| Shonkwiler Arthur K | $9,500 | Old Republic Title Ltd |
Source: Public Records
Mortgage History
| Date | Status | Borrower | Loan Amount |
|---|---|---|---|
| Previous Owner | Lien Daniel B | $143,100 | |
| Previous Owner | Cruikshank David M | $128,250 |
Source: Public Records
Tax History Compared to Growth
Tax History
| Year | Tax Paid | Tax Assessment Tax Assessment Total Assessment is a certain percentage of the fair market value that is determined by local assessors to be the total taxable value of land and additions on the property. | Land | Improvement |
|---|---|---|---|---|
| 2024 | $7,423 | $743,000 | $515,000 | $228,000 |
| 2023 | $6,681 | $678,000 | $460,000 | $218,000 |
| 2022 | $6,426 | $759,000 | $374,000 | $385,000 |
| 2021 | $5,723 | $673,000 | $347,000 | $326,000 |
| 2020 | $5,757 | $565,000 | $296,000 | $269,000 |
| 2018 | $5,265 | $578,000 | $314,000 | $264,000 |
| 2017 | $4,558 | $512,000 | $279,000 | $233,000 |
| 2016 | $4,018 | $457,000 | $230,000 | $227,000 |
| 2015 | $3,498 | $392,000 | $209,000 | $183,000 |
| 2014 | -- | $348,000 | $186,000 | $162,000 |
| 2013 | -- | $321,000 | $172,000 | $149,000 |
Source: Public Records
Map
Nearby Homes
- 8513 19th Ave NW Unit B
- 8739 17th Ave NW
- 320 NW 85th St
- 8333 17th Ave NW
- 8356 16th Ave NW
- 8324 16th Ave NW Unit E
- 8324 16th Ave NW Unit D
- 8324 16th Ave NW Unit B
- 1525 NW 90th St
- 8040 19th Ave NW
- 9023 Mary Ave NW Unit 401
- 8020 17th Ave NW
- 8751 14th Ave NW Unit G
- 9044 15th Ave NW
- 9233 20th Ave NW
- 2393 NW 90th St
- 8045 Mary Ave NW
- 9045 Mary Ave NW Unit D
- 8740 14th Ave NW
- 8326 14th Ave NW
- 8546 19th Ave NW
- 8538 19th Ave NW
- 8548 19th Ave NW
- 8534 19th Ave NW
- 8537 18th Ave NW
- 8535 18th Ave NW
- 8541 18th Ave NW
- 8552 19th Ave NW
- 8530 19th Ave NW
- 8533 18th Ave NW
- 8547 18th Ave NW
- 8543 19th Ave NW
- 8545 19th Ave NW
- 8537 19th Ave NW
- 8558 19th Ave NW
- 8529 18th Ave NW
- 8553 19th Ave NW
- 8535 19th Ave NW
- 8557 18th Ave NW