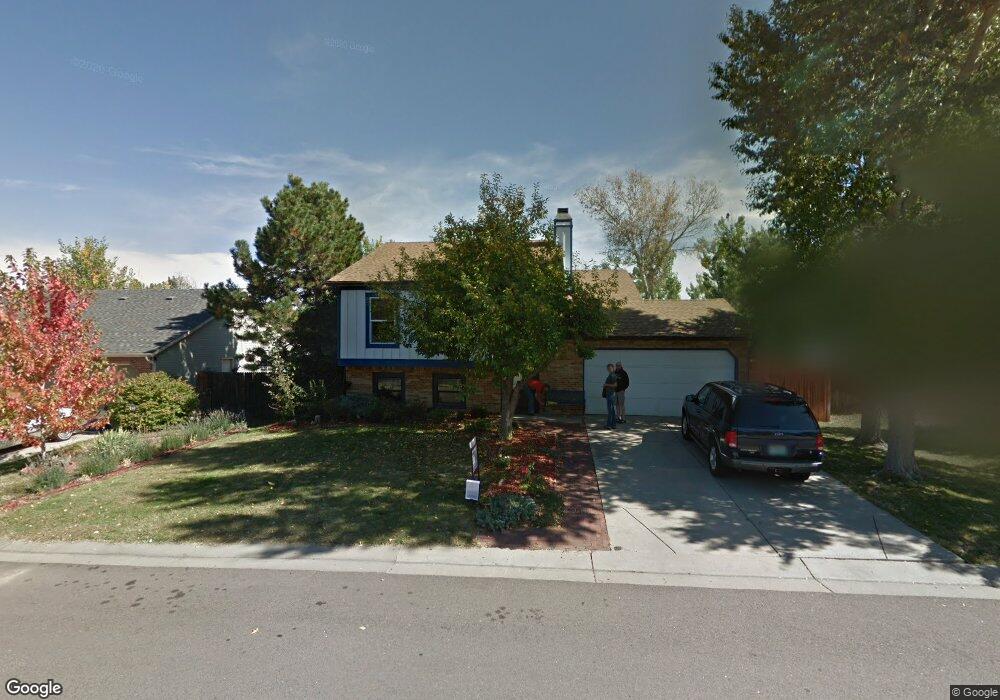
8548 Buckwheat Run Parker, CO 80134
Cottonwood NeighborhoodEstimated Value: $476,000 - $518,000
4
Beds
2
Baths
1,740
Sq Ft
$285/Sq Ft
Est. Value
About This Home
This home is located at 8548 Buckwheat Run, Parker, CO 80134 and is currently estimated at $496,101, approximately $285 per square foot. 8548 Buckwheat Run is a home located in Douglas County with nearby schools including Pine Lane Elementary School, Sierra Middle School, and Chaparral High School.
Ownership History
Date
Name
Owned For
Owner Type
Purchase Details
Closed on
Nov 4, 2011
Sold by
Susan D Fryberger Revocable Living Trust
Bought by
Hoemke Paul Mf and Hoemke Catherine F
Current Estimated Value
Home Financials for this Owner
Home Financials are based on the most recent Mortgage that was taken out on this home.
Original Mortgage
$158,691
Outstanding Balance
$106,791
Interest Rate
3.75%
Mortgage Type
FHA
Estimated Equity
$389,310
Purchase Details
Closed on
Jan 23, 2006
Sold by
Fryberger Robin M
Bought by
Fryberger Susan D
Purchase Details
Closed on
Jan 30, 1991
Sold by
Us Dept Housing & Urban Dev
Bought by
Fryberger Robin M and Fryberger Susan D
Purchase Details
Closed on
Sep 20, 1990
Sold by
Public Trustee
Bought by
Us Dept Housing & Urban Dev
Purchase Details
Closed on
Jul 28, 1988
Sold by
Otoole Brian D and Otoole Jan
Bought by
Furuli Debbie
Purchase Details
Closed on
Jan 31, 1984
Sold by
American Continental Corp
Bought by
Otoole Brian D and Otoole Jan
Create a Home Valuation Report for This Property
The Home Valuation Report is an in-depth analysis detailing your home's value as well as a comparison with similar homes in the area
Home Values in the Area
Average Home Value in this Area
Purchase History
| Date | Buyer | Sale Price | Title Company |
|---|---|---|---|
| Hoemke Paul Mf | $168,000 | Fidelity National Title Insu | |
| Fryberger Susan D | -- | None Available | |
| Fryberger Robin M | $71,300 | -- | |
| Us Dept Housing & Urban Dev | -- | -- | |
| Furuli Debbie | $87,200 | -- | |
| Otoole Brian D | $87,500 | -- |
Source: Public Records
Mortgage History
| Date | Status | Borrower | Loan Amount |
|---|---|---|---|
| Open | Hoemke Paul Mf | $158,691 |
Source: Public Records
Tax History Compared to Growth
Tax History
| Year | Tax Paid | Tax Assessment Tax Assessment Total Assessment is a certain percentage of the fair market value that is determined by local assessors to be the total taxable value of land and additions on the property. | Land | Improvement |
|---|---|---|---|---|
| 2024 | $2,968 | $33,700 | $8,500 | $25,200 |
| 2023 | $2,956 | $33,700 | $8,500 | $25,200 |
| 2022 | $2,489 | $24,880 | $5,140 | $19,740 |
| 2021 | $2,587 | $24,880 | $5,140 | $19,740 |
| 2020 | $2,477 | $24,180 | $4,810 | $19,370 |
| 2019 | $2,496 | $24,180 | $4,810 | $19,370 |
| 2018 | $2,162 | $20,550 | $4,880 | $15,670 |
| 2017 | $2,064 | $20,550 | $4,880 | $15,670 |
| 2016 | $1,925 | $18,320 | $3,580 | $14,740 |
| 2015 | $2,036 | $18,320 | $3,580 | $14,740 |
| 2014 | $1,754 | $14,060 | $3,180 | $10,880 |
Source: Public Records
Map
Nearby Homes
- 8567 Rabbitbrush Way
- 8460 Curlycup Place
- 8465 Wheatgrass Cir
- 8695 Bluebunch Ct
- 8421 Rabbitbrush Way
- 16631 Blue Mist Cir
- 8442 Blazing Star Place
- 8434 Golden Eye Dr
- 8653 Red Clover Ct
- 8338 Bluegrass Cir
- 16453 E Phillips Dr
- 16049 Brooklime Ct
- 8804 Clover Meadow Ln
- 15957 Brooklime Ct
- 16276 E Otero Place
- 8463 Bed Straw St
- 8354 Dove Ridge Way
- 16031 Azalea Ave
- 15936 Red Bud Dr
- 8045 S Kalispell Way
- 8556 Buckwheat Run
- 8538 Buckwheat Run
- 8514 Wheatgrass Cir
- 8512 Wheatgrass Cir
- 8566 Buckwheat Run
- 8547 Buckwheat Run
- 8518 Wheatgrass Cir
- 8530 Buckwheat Run
- 8559 Buckwheat Run
- 8535 Buckwheat Run
- 8498 Wheatgrass Cir
- 8524 Wheatgrass Cir
- 8569 Buckwheat Run
- 8574 Buckwheat Run
- 8530 Wheatgrass Cir
- 8496 Wheatgrass Cir
- 8568 Rabbitbrush Way
- 8497 Wheatgrass Cir
- 8576 Rabbitbrush Way
- 8560 Rabbitbrush Way