A
Seller's Agent in 2026
Andrea Davies
LPT Realty, Inc.
(530) 351-2380
1 in this area
9 Total Sales
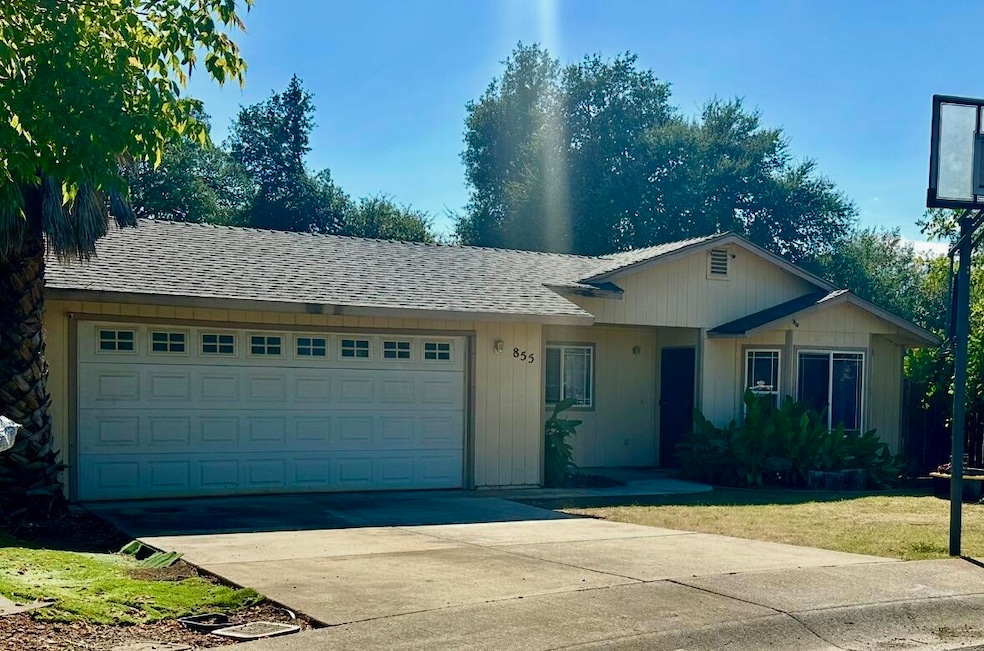
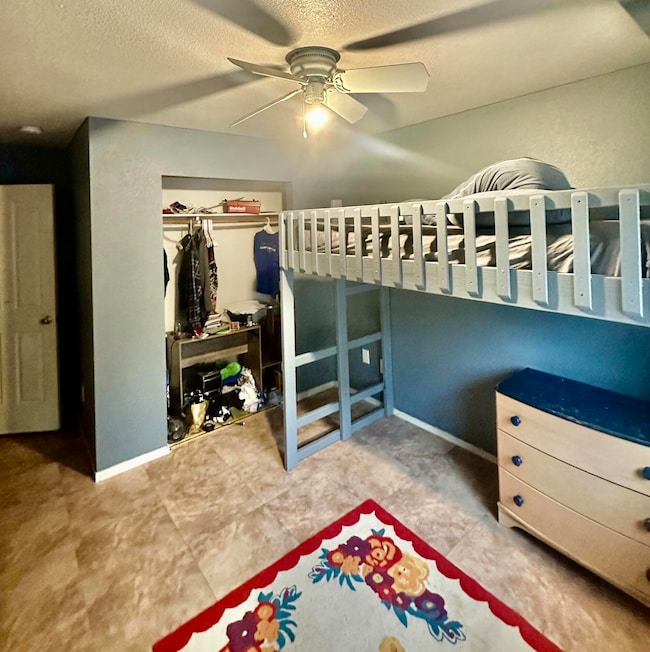
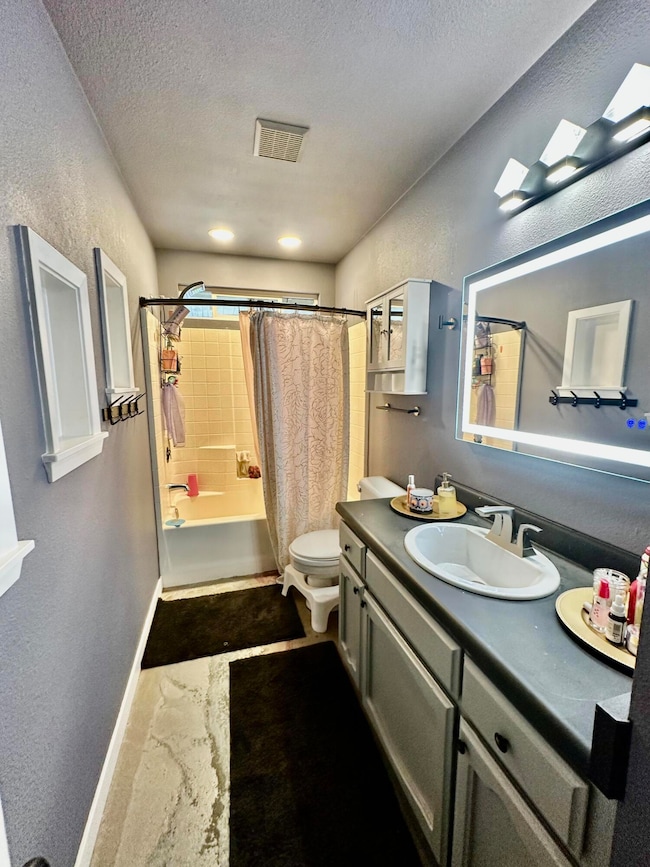
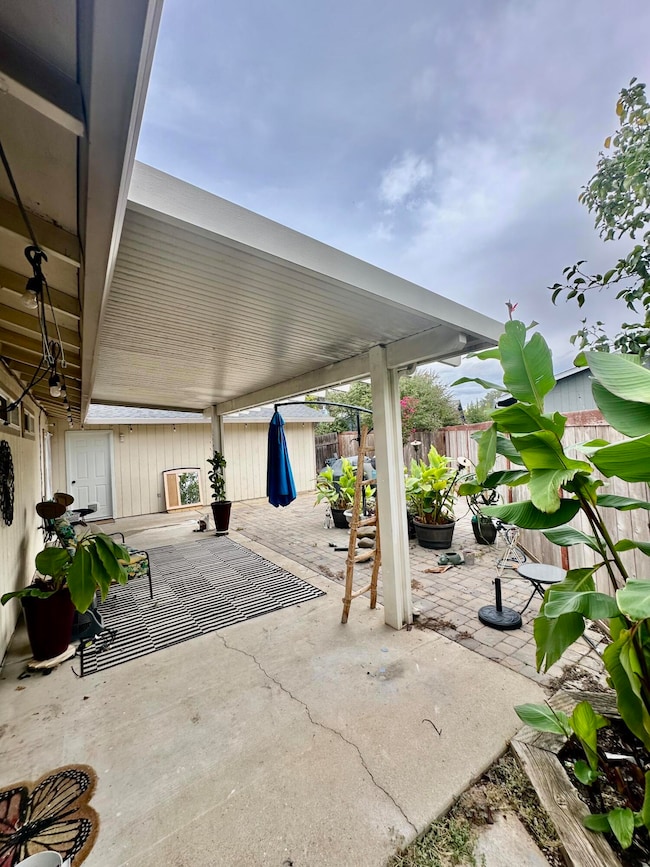
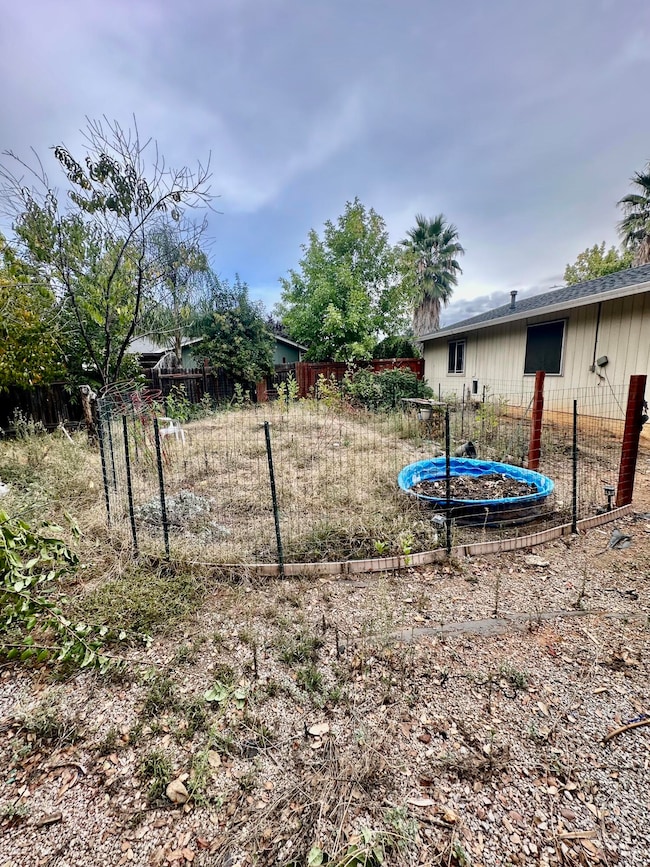
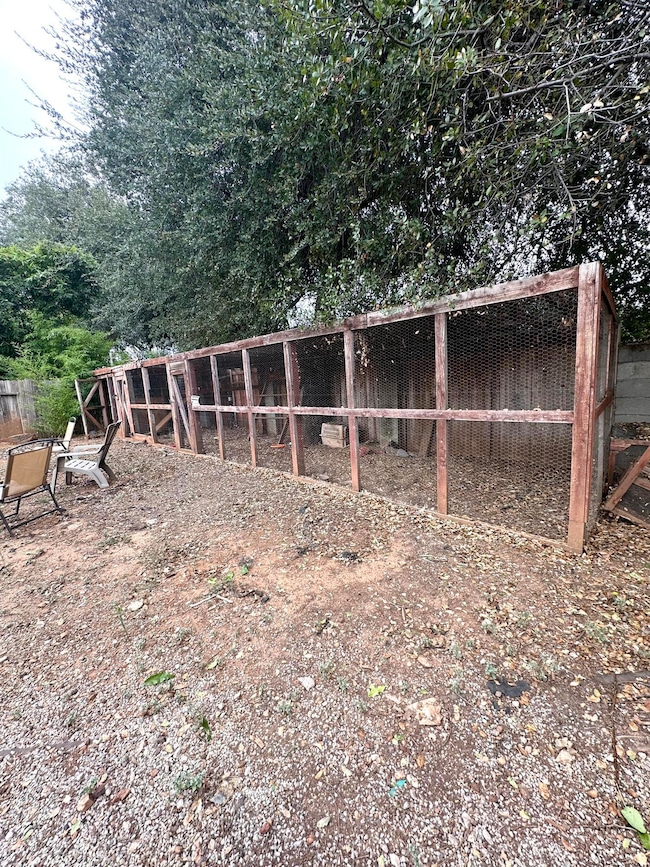
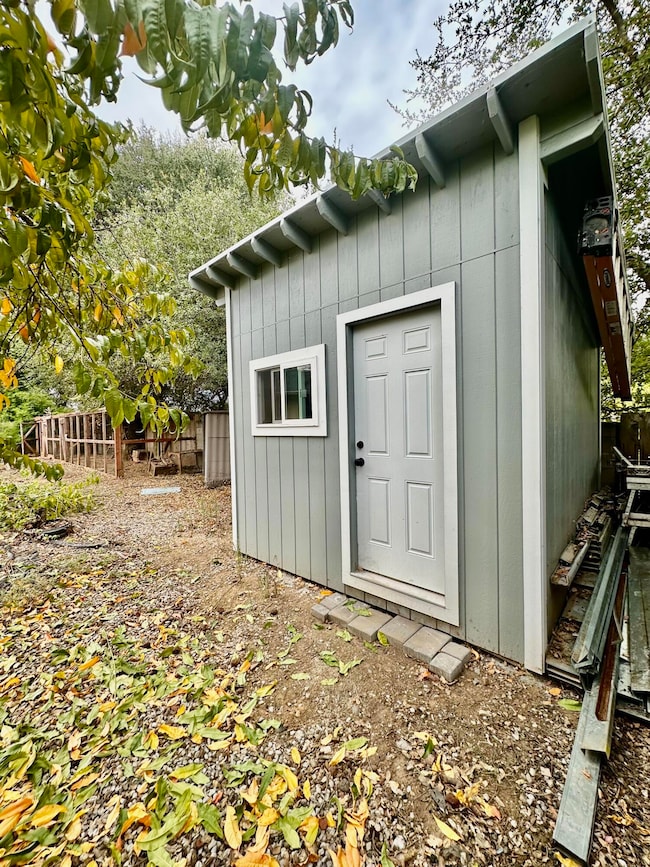
Welcome home! This 4 bed, 2 bath charmer sits on a spacious lot in a family friendly cul-de-sac. Enjoy cozy evenings by the fireplace or gather outdoors around the fire pit and covered patio. Conveniently located near the new Costco and Save Mart shopping centers. A wonderful blend of comfort, space, and location.
Last Agent to Sell the Property
LPT Realty, Inc. License #02229464 Listed on: 10/13/2025
| Date | Type | Sale Price | Title Company |
|---|---|---|---|
| Grant Deed | $320,000 | Fidelity National Title Compan | |
| Grant Deed | $237,000 | Placer Title Company | |
| Interfamily Deed Transfer | -- | First American Title Co | |
| Grant Deed | $208,000 | First American Title Co | |
| Interfamily Deed Transfer | -- | First American Title Co | |
| Grant Deed | $110,500 | Placer Title Company | |
| Grant Deed | $22,500 | Placer Title Company | |
| Grant Deed | $22,500 | Placer Title Company |
| Date | Status | Loan Amount | Loan Type |
|---|---|---|---|
| Open | $240,000 | New Conventional | |
| Previous Owner | $232,461 | FHA | |
| Previous Owner | $187,200 | Purchase Money Mortgage | |
| Previous Owner | $112,469 | VA |
| Date | Event | Price | List to Sale | Price per Sq Ft |
|---|---|---|---|---|
| 01/05/2026 01/05/26 | Sold | $320,000 | -4.5% | $232 / Sq Ft |
| 12/05/2025 12/05/25 | Pending | -- | -- | -- |
| 11/13/2025 11/13/25 | Price Changed | $335,000 | -4.3% | $243 / Sq Ft |
| 10/30/2025 10/30/25 | Price Changed | $350,000 | -2.8% | $254 / Sq Ft |
| 10/13/2025 10/13/25 | For Sale | $359,900 | -- | $261 / Sq Ft |
| Year | Tax Paid | Tax Assessment Tax Assessment Total Assessment is a certain percentage of the fair market value that is determined by local assessors to be the total taxable value of land and additions on the property. | Land | Improvement |
|---|---|---|---|---|
| 2025 | $2,874 | $264,094 | $44,617 | $219,477 |
| 2024 | $2,834 | $258,917 | $43,743 | $215,174 |
| 2023 | $2,834 | $253,841 | $42,886 | $210,955 |
| 2022 | $2,754 | $248,865 | $42,046 | $206,819 |
| 2021 | $2,660 | $243,986 | $41,222 | $202,764 |
| 2020 | $2,649 | $241,485 | $40,800 | $200,685 |
| 2019 | $2,619 | $236,000 | $40,000 | $196,000 |
| 2018 | $2,022 | $180,000 | $42,000 | $138,000 |
| 2017 | $1,949 | $167,000 | $40,000 | $127,000 |
| 2016 | $1,805 | $162,000 | $35,000 | $127,000 |
| 2015 | $1,707 | $152,000 | $35,000 | $117,000 |
| 2014 | $1,538 | $142,000 | $25,000 | $117,000 |
A
Seller's Agent in 2026
Andrea Davies
LPT Realty, Inc.
(530) 351-2380
1 in this area
9 Total Sales
M
Buyer's Agent in 2026
Michele Digesti
Coldwell Banker Select Real Estate - Redding
1 in this area
2 Total Sales
Source: Shasta Association of REALTORS®
MLS Number: 25-4464
APN: 068-140-033-000
Disclaimer: Certain information contained herein is derived from information provided by parties other than Homes.com. All information provided is deemed reliable, but is not guaranteed to be accurate and should be independently verified.
![]() IDX information is provided exclusively for personal, non-commercial use, and may not be used for any purpose other than to identify prospective properties consumers may be interested in purchasing. Information is deemed reliable but not guaranteed.
IDX information is provided exclusively for personal, non-commercial use, and may not be used for any purpose other than to identify prospective properties consumers may be interested in purchasing. Information is deemed reliable but not guaranteed.
Ask me questions while you tour the home.
