Estimated Value: $501,000 - $589,000
4
Beds
3
Baths
1,898
Sq Ft
$283/Sq Ft
Est. Value
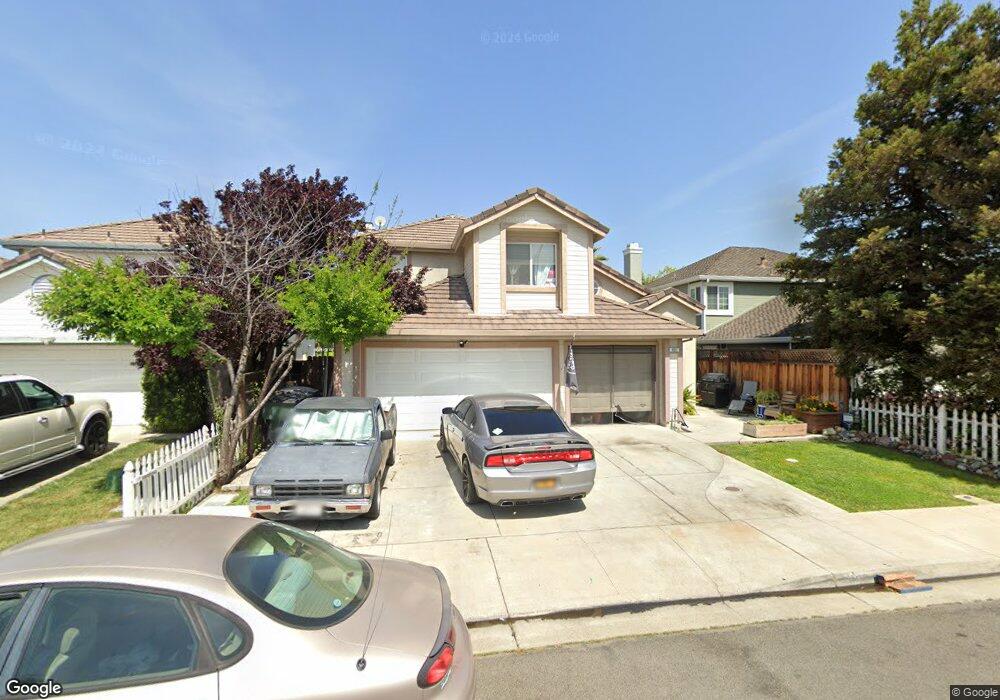
About This Home
This home is located at 855 Manor Ct, Tracy, CA 95376 and is currently estimated at $536,890, approximately $282 per square foot. 855 Manor Ct is a home located in San Joaquin County with nearby schools including McKinley Elementary School, Monte Vista Middle School, and Merrill F. West High School.
Ownership History
Date
Name
Owned For
Owner Type
Purchase Details
Closed on
Oct 27, 2023
Sold by
Wang Raymond
Bought by
Raymond Wang Living Trust and Wang
Current Estimated Value
Purchase Details
Closed on
Jul 19, 2017
Sold by
Awpp Llc
Bought by
Wang Raymond
Home Financials for this Owner
Home Financials are based on the most recent Mortgage that was taken out on this home.
Original Mortgage
$278,000
Interest Rate
3.91%
Mortgage Type
Balloon
Purchase Details
Closed on
Feb 6, 2012
Sold by
Flagstar Capital Markets Corporation
Bought by
Awpp Llc
Purchase Details
Closed on
Nov 1, 2011
Sold by
Federal National Mortgage Association
Bought by
Flagstar Capital Markets Corporation
Purchase Details
Closed on
Jul 6, 2010
Sold by
Hernandez Jose Meza and Posadas Miriam
Bought by
Federal National Mortgage Association
Purchase Details
Closed on
Jun 26, 2008
Sold by
Hernandez Jose M and Posadas Miriam
Bought by
Hernandez Jose M and Posadas Miriam
Home Financials for this Owner
Home Financials are based on the most recent Mortgage that was taken out on this home.
Original Mortgage
$242,250
Interest Rate
5.99%
Mortgage Type
Purchase Money Mortgage
Purchase Details
Closed on
Jun 10, 2008
Sold by
Indymac Bank Fsb
Bought by
Hernandez Jose Meza and Posadas Miriam
Home Financials for this Owner
Home Financials are based on the most recent Mortgage that was taken out on this home.
Original Mortgage
$242,250
Interest Rate
5.99%
Mortgage Type
Purchase Money Mortgage
Purchase Details
Closed on
Apr 4, 2008
Sold by
Khan Tabrez F
Bought by
Indymac Bank Fsb
Purchase Details
Closed on
Dec 27, 2004
Sold by
Khan Ramiza S
Bought by
Khan Tabrez F
Purchase Details
Closed on
Mar 22, 2000
Sold by
Silva Alice M
Bought by
Khan Tabrez F and Khan Ramiza S
Home Financials for this Owner
Home Financials are based on the most recent Mortgage that was taken out on this home.
Original Mortgage
$176,000
Interest Rate
8.38%
Mortgage Type
Stand Alone First
Purchase Details
Closed on
Jan 13, 2000
Sold by
Silva Ronald G
Bought by
Silva Alice M
Purchase Details
Closed on
Apr 29, 1994
Sold by
Tracy Nine Project
Bought by
Silva Ronald G and Silva Alice M
Home Financials for this Owner
Home Financials are based on the most recent Mortgage that was taken out on this home.
Original Mortgage
$139,950
Interest Rate
7.87%
Create a Home Valuation Report for This Property
The Home Valuation Report is an in-depth analysis detailing your home's value as well as a comparison with similar homes in the area
Home Values in the Area
Average Home Value in this Area
Purchase History
| Date | Buyer | Sale Price | Title Company |
|---|---|---|---|
| Raymond Wang Living Trust | -- | None Listed On Document | |
| Wang Raymond | -- | Chicago Title Company | |
| Awpp Llc | $175,000 | Lsi Title Company | |
| Flagstar Capital Markets Corporation | -- | First American Equity Loan S | |
| Federal National Mortgage Association | $213,060 | First American Title Company | |
| Hernandez Jose M | -- | None Available | |
| Hernandez Jose Meza | $255,000 | Fidelity National Title Co | |
| Indymac Bank Fsb | $296,728 | None Available | |
| Khan Tabrez F | -- | -- | |
| Khan Tabrez F | $220,000 | Fidelity National Title Co | |
| Silva Alice M | -- | Fidelity National Title Co | |
| Silva Ronald G | $175,000 | Old Republic Title Company |
Source: Public Records
Mortgage History
| Date | Status | Borrower | Loan Amount |
|---|---|---|---|
| Previous Owner | Wang Raymond | $278,000 | |
| Previous Owner | Hernandez Jose Meza | $242,250 | |
| Previous Owner | Khan Tabrez F | $176,000 | |
| Previous Owner | Silva Ronald G | $139,950 | |
| Closed | Khan Tabrez F | $22,000 |
Source: Public Records
Tax History
| Year | Tax Paid | Tax Assessment Tax Assessment Total Assessment is a certain percentage of the fair market value that is determined by local assessors to be the total taxable value of land and additions on the property. | Land | Improvement |
|---|---|---|---|---|
| 2025 | $2,542 | $219,799 | $54,005 | $165,794 |
| 2024 | $2,343 | $215,491 | $52,947 | $162,544 |
| 2023 | $2,306 | $211,266 | $51,909 | $159,357 |
| 2022 | $2,260 | $207,125 | $50,892 | $156,233 |
| 2021 | $2,234 | $203,065 | $49,895 | $153,170 |
| 2020 | $2,219 | $200,984 | $49,384 | $151,600 |
| 2019 | $2,184 | $197,044 | $48,416 | $148,628 |
| 2018 | $2,422 | $193,181 | $47,467 | $145,714 |
| 2017 | $2,389 | $189,394 | $46,537 | $142,857 |
| 2016 | $2,303 | $185,680 | $45,624 | $140,056 |
| 2014 | $2,186 | $179,310 | $44,059 | $135,251 |
Source: Public Records
Map
Nearby Homes
- 875 Westleigh Ct
- 2198 Walsingham Ct
- 2270 Chester Dr
- 539 W Lowell Ave
- 522 W Grant Line Rd
- 508 W Grant Line Rd
- 1823 Wall St
- 445 W Lowell Ave
- 1506 Madison Ave
- 1416 Audrey Dr
- 262 W Lowell Ave
- 1636 Parker Ave
- 2901 San Rocco Ct
- 206 W 20th St
- 1651 W Beverly Place
- 1330 Bessie Ave
- 1533 Vinewood Way
- 1800 Duncan Dr
- 1463 Evergreen Ct
- 812 W Clover Rd Unit 51
- 865 Manor Ct
- 845 Manor Ct
- 850 Westleigh Ct
- 835 Manor Ct
- 860 Westleigh Ct
- 875 Manor Ct
- 840 Westleigh Ct
- 830 Westleigh Ct
- 825 Manor Ct
- 885 Manor Ct
- 820 Westleigh Ct
- 870 Westleigh Ct
- 1940 Homer Henry Ct
- 1920 Homer Henry Ct
- 1960 Homer Henry Ct
- 845 Westleigh Ct
- 855 Westleigh Ct
- 1980 Homer Henry Ct
- 835 Westleigh Ct
- 1940 Vallerand Rd
Your Personal Tour Guide
Ask me questions while you tour the home.