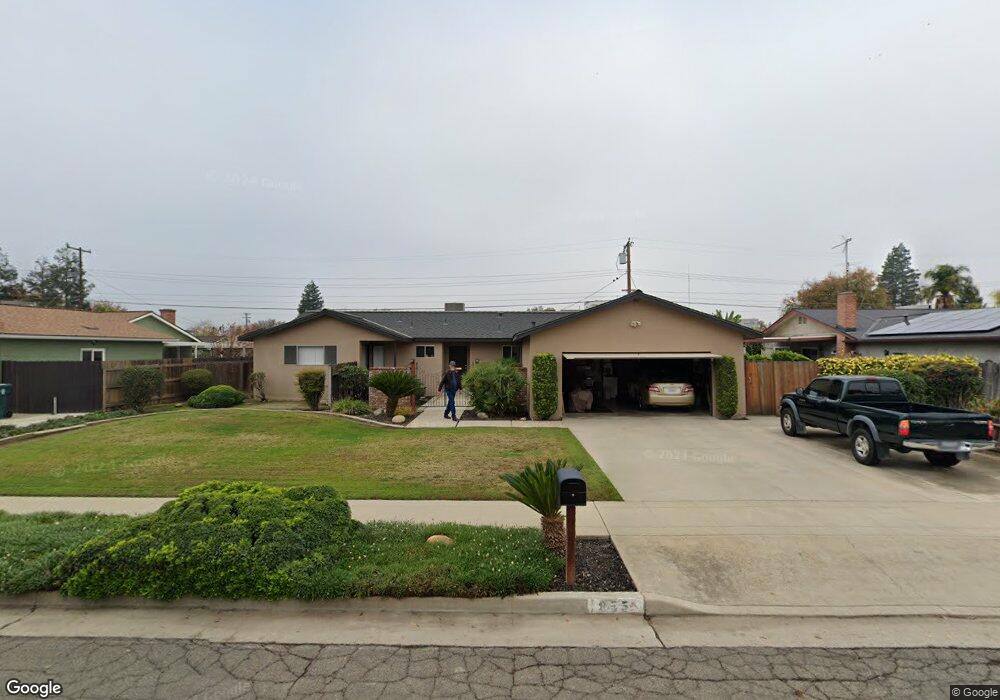
855 N Mahaleb St Tulare, CA 93274
Northeast Tulare NeighborhoodEstimated Value: $328,421 - $355,000
2
Beds
3
Baths
1,540
Sq Ft
$224/Sq Ft
Est. Value
About This Home
This home is located at 855 N Mahaleb St, Tulare, CA 93274 and is currently estimated at $344,855, approximately $223 per square foot. 855 N Mahaleb St is a home located in Tulare County with nearby schools including Garden Elementary School, Cherry Avenue Middle School, and Tulare Western High School.
Ownership History
Date
Name
Owned For
Owner Type
Purchase Details
Closed on
Oct 21, 2020
Sold by
Cantrell Michelle Marie and Eckert Mary Annette
Bought by
Cantrell Michelle Toledo
Current Estimated Value
Purchase Details
Closed on
Oct 13, 2016
Sold by
Cantrell Michelle Marie
Bought by
Cantrell Michelle Marie and Eckert Mary Annette
Purchase Details
Closed on
Oct 26, 2006
Sold by
Toledo Lorry
Bought by
Toledo Manuel and Toledo Lorry
Purchase Details
Closed on
Sep 28, 2004
Sold by
Mattos Dolores M
Bought by
Toledo Manuel and Toledo Lorry
Home Financials for this Owner
Home Financials are based on the most recent Mortgage that was taken out on this home.
Original Mortgage
$55,000
Interest Rate
5.76%
Mortgage Type
Purchase Money Mortgage
Purchase Details
Closed on
Oct 19, 1999
Sold by
Mattos Dolores M
Bought by
Mattos Dolores M
Create a Home Valuation Report for This Property
The Home Valuation Report is an in-depth analysis detailing your home's value as well as a comparison with similar homes in the area
Home Values in the Area
Average Home Value in this Area
Purchase History
| Date | Buyer | Sale Price | Title Company |
|---|---|---|---|
| Cantrell Michelle Toledo | -- | None Available | |
| Cantrell Michelle Marie | -- | None Available | |
| Toledo Manuel | -- | None Available | |
| Toledo Manuel | $60,000 | Chicago Title Co | |
| Mattos Dolores M | -- | -- |
Source: Public Records
Mortgage History
| Date | Status | Borrower | Loan Amount |
|---|---|---|---|
| Previous Owner | Toledo Manuel | $55,000 |
Source: Public Records
Tax History Compared to Growth
Tax History
| Year | Tax Paid | Tax Assessment Tax Assessment Total Assessment is a certain percentage of the fair market value that is determined by local assessors to be the total taxable value of land and additions on the property. | Land | Improvement |
|---|---|---|---|---|
| 2025 | $2,671 | $245,412 | $39,042 | $206,370 |
| 2024 | $2,671 | $240,601 | $38,277 | $202,324 |
| 2023 | $1,789 | $162,149 | $41,425 | $120,724 |
| 2022 | $1,737 | $158,970 | $40,613 | $118,357 |
| 2021 | $1,715 | $155,853 | $39,817 | $116,036 |
| 2020 | $1,744 | $154,255 | $39,409 | $114,846 |
| 2019 | $1,788 | $151,230 | $38,636 | $112,594 |
| 2018 | $1,759 | $148,264 | $37,878 | $110,386 |
| 2017 | $1,742 | $145,357 | $37,135 | $108,222 |
| 2016 | $644 | $62,113 | $11,378 | $50,735 |
| 2015 | $620 | $61,180 | $11,207 | $49,973 |
| 2014 | $620 | $59,981 | $10,987 | $48,994 |
Source: Public Records
Map
Nearby Homes
- 855 E Pleasant Ave
- 0 N Cherry St Unit 234531
- 1034 N Manor Dr
- 563 N O St
- 2012 Diamante Dr
- 980 E Apricot Ave
- 1052 E Apricot Ave
- 1145 N M St
- 273 E Gannon Dr
- 260 E Merritt Ave
- 320 N Blackstone St Unit 14
- 861 E Sycamore Ave
- 815 E Sycamore Ave
- 1563 E Glenwood Ave
- 445 E Chevy Chase Dr
- 1128 N Jefferson St
- 1705 E Cross Ave
- 149 S Salida Place
- 479 E Sandra Ave
- 1110 Grove Dr
- 837 N Mahaleb St
- 873 N Mahaleb St
- 854 N Terrace Park St
- 836 N Terrace Park St
- 872 N Terrace Park St
- 819 N Mahaleb St
- 891 N Mahaleb St
- 852 N Mahaleb St
- 870 N Mahaleb St
- 834 N Mahaleb St
- 818 N Terrace Park St
- 890 N Terrace Park St
- 888 N Mahaleb St
- 801 N Mahaleb St
- 909 N Mahaleb St
- 816 N Mahaleb St
- 841 N Arbor Dr
- 908 N Terrace Park St
- 849 N Arbor Dr
- 896 N Mahaleb St