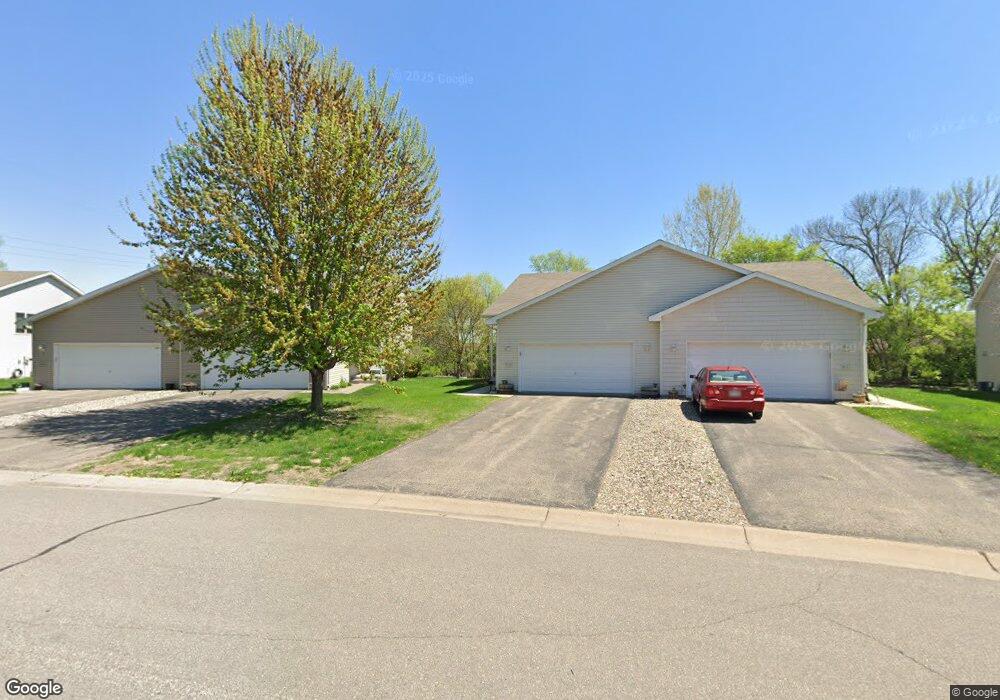
855 Ravoux Cir Chaska, MN 55318
Estimated Value: $288,956 - $315,000
3
Beds
2
Baths
986
Sq Ft
$306/Sq Ft
Est. Value
About This Home
This home is located at 855 Ravoux Cir, Chaska, MN 55318 and is currently estimated at $301,989, approximately $306 per square foot. 855 Ravoux Cir is a home located in Carver County with nearby schools including Kisthardt Elementary School, Carver Elementary School, and Pioneer Ridge Middle School.
Ownership History
Date
Name
Owned For
Owner Type
Purchase Details
Closed on
Jul 28, 2017
Sold by
Cheam Sophann and Cheam Katherine J
Bought by
Remiger Jason M and Remiger Blanca G
Current Estimated Value
Home Financials for this Owner
Home Financials are based on the most recent Mortgage that was taken out on this home.
Original Mortgage
$193,705
Outstanding Balance
$161,282
Interest Rate
3.88%
Mortgage Type
New Conventional
Estimated Equity
$140,707
Purchase Details
Closed on
Jan 27, 2006
Sold by
Carver County Housing & Redevelopment Au
Bought by
Cheam Sophann and Dean Katherine J
Home Financials for this Owner
Home Financials are based on the most recent Mortgage that was taken out on this home.
Original Mortgage
$191,400
Interest Rate
6.3%
Mortgage Type
New Conventional
Create a Home Valuation Report for This Property
The Home Valuation Report is an in-depth analysis detailing your home's value as well as a comparison with similar homes in the area
Home Values in the Area
Average Home Value in this Area
Purchase History
| Date | Buyer | Sale Price | Title Company |
|---|---|---|---|
| Remiger Jason M | $203,900 | Home Title Inc | |
| Cheam Sophann | $211,400 | -- |
Source: Public Records
Mortgage History
| Date | Status | Borrower | Loan Amount |
|---|---|---|---|
| Open | Remiger Jason M | $193,705 | |
| Previous Owner | Cheam Sophann | $191,400 |
Source: Public Records
Tax History
| Year | Tax Paid | Tax Assessment Tax Assessment Total Assessment is a certain percentage of the fair market value that is determined by local assessors to be the total taxable value of land and additions on the property. | Land | Improvement |
|---|---|---|---|---|
| 2025 | $3,166 | $290,700 | $90,000 | $200,700 |
| 2024 | $3,204 | $280,700 | $80,000 | $200,700 |
| 2023 | $2,990 | $282,200 | $80,000 | $202,200 |
| 2022 | $2,694 | $275,700 | $75,900 | $199,800 |
| 2021 | $2,462 | $217,600 | $63,200 | $154,400 |
| 2020 | $2,444 | $214,500 | $63,200 | $151,300 |
| 2019 | $2,358 | $199,400 | $60,200 | $139,200 |
| 2018 | $2,218 | $199,400 | $60,200 | $139,200 |
| 2017 | $2,338 | $187,600 | $54,800 | $132,800 |
| 2016 | $2,406 | $170,400 | $0 | $0 |
| 2015 | $1,778 | $156,100 | $0 | $0 |
| 2014 | $1,778 | $119,100 | $0 | $0 |
Source: Public Records
Map
Nearby Homes
- 1242 Crystal Place E
- 1427 Ravoux Ln
- 952 Conner St
- 954 Conner St
- 332 Brickyard Dr
- 4848 Engler Blvd
- 1340 Broadview Ave
- 225 Cardinal Ln
- 504 N Maple St
- 217 Beech St
- 215 N Maple St
- 934 Goldfinch St
- 1135 Moers Dr
- 213 N Walnut St
- 217 N Walnut St
- 215 N Walnut St
- 307 W 5th St
- 867 Oriole Ln
- 715 Liberty Heights Dr
- 312 Wagon Wheel Ln Unit 16
- 851 Ravoux Cir
- 859 Ravoux Cir
- 847 Ravoux Cir
- 863 Ravoux Cir
- 843 Ravoux Cir
- 867 Ravoux Cir
- 1336 Prairie St
- 871 Ravoux Cir
- 839 Ravoux Cir
- 1330 Prairie St
- 1342 Prairie St
- 835 Ravoux Cir
- 1348 Prairie St
- 848 Ravoux Cir
- 1324 Prairie St
- 852 Ravoux Cir
- 831 Ravoux Cir
- 844 Ravoux Cir
- 840 Ravoux Cir
- 1354 Prairie St