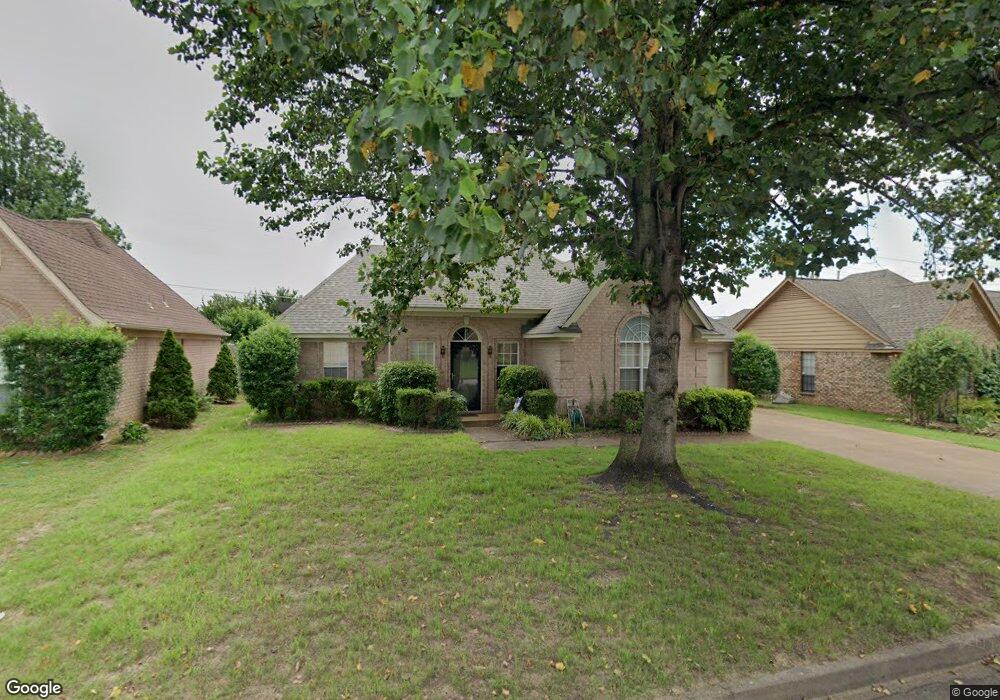
8553 Shingle Oaks Dr Cordova, TN 38018
Cordova NeighborhoodEstimated Value: $260,404 - $293,000
3
Beds
2
Baths
1,643
Sq Ft
$165/Sq Ft
Est. Value
About This Home
This home is located at 8553 Shingle Oaks Dr, Cordova, TN 38018 and is currently estimated at $271,101, approximately $165 per square foot. 8553 Shingle Oaks Dr is a home located in Shelby County with nearby schools including Cordova Elementary School, Cordova High School, and Memphis School of Excellence Cordova Elementary.
Ownership History
Date
Name
Owned For
Owner Type
Purchase Details
Closed on
Dec 29, 2009
Sold by
Gonzalez Boris R
Bought by
The Brg Living Trust
Current Estimated Value
Purchase Details
Closed on
Sep 10, 2002
Sold by
Cendant Mobility Financial Corp
Bought by
Gonzales Boris R
Home Financials for this Owner
Home Financials are based on the most recent Mortgage that was taken out on this home.
Original Mortgage
$96,750
Outstanding Balance
$39,469
Interest Rate
6.18%
Mortgage Type
Unknown
Estimated Equity
$231,632
Purchase Details
Closed on
Apr 6, 2002
Sold by
Anderson Barbara and Anderson Barbara B
Bought by
Cendant Mobility Financial Corp and Mid South Title Agency Inc
Purchase Details
Closed on
Oct 27, 1999
Sold by
Doherty Robin P
Bought by
Anderson Barbara
Home Financials for this Owner
Home Financials are based on the most recent Mortgage that was taken out on this home.
Original Mortgage
$110,000
Interest Rate
7.81%
Create a Home Valuation Report for This Property
The Home Valuation Report is an in-depth analysis detailing your home's value as well as a comparison with similar homes in the area
Home Values in the Area
Average Home Value in this Area
Purchase History
| Date | Buyer | Sale Price | Title Company |
|---|---|---|---|
| The Brg Living Trust | -- | None Available | |
| The Brg Living Trust | -- | None Available | |
| Gonzales Boris R | $129,000 | Mid South Title Agency Inc | |
| Cendant Mobility Financial Corp | $143,000 | -- | |
| Anderson Barbara | $137,500 | Mid America Title Agency Inc | |
| Anderson Barbara | $137,500 | Mid America Title Agency Inc |
Source: Public Records
Mortgage History
| Date | Status | Borrower | Loan Amount |
|---|---|---|---|
| Open | Gonzales Boris R | $96,750 | |
| Previous Owner | Anderson Barbara | $110,000 |
Source: Public Records
Tax History Compared to Growth
Tax History
| Year | Tax Paid | Tax Assessment Tax Assessment Total Assessment is a certain percentage of the fair market value that is determined by local assessors to be the total taxable value of land and additions on the property. | Land | Improvement |
|---|---|---|---|---|
| 2025 | -- | $65,425 | $14,750 | $50,675 |
| 2024 | -- | $45,525 | $8,500 | $37,025 |
| 2023 | $2,773 | $45,525 | $8,500 | $37,025 |
| 2022 | $2,773 | $45,525 | $8,500 | $37,025 |
| 2021 | $2,806 | $45,525 | $8,500 | $37,025 |
| 2020 | $2,475 | $34,150 | $8,500 | $25,650 |
| 2019 | $2,475 | $34,150 | $8,500 | $25,650 |
| 2018 | $2,475 | $34,150 | $8,500 | $25,650 |
| 2017 | $1,404 | $34,150 | $8,500 | $25,650 |
| 2016 | $1,320 | $30,200 | $0 | $0 |
| 2014 | $1,320 | $30,200 | $0 | $0 |
Source: Public Records
Map
Nearby Homes
- 8532 Shingle Oaks Dr
- 8659 Colleton Way
- 8663 Colleton Way
- 8664 Eagle View Dr
- 8667 Colleton Way
- 8671 Colleton Way
- 8675 Colleton Way
- 747 Overcup Oaks Cove
- 857 Paradise Dr
- 470 Walnut Point Cove
- 8643 Timber Creek Dr
- 0 Chelsea Meadow Lot 40 Cove Unit 10005859
- 8524 Shady Elm Dr
- 8301 Weatherwood Ln
- 370 Lida Ln
- 8502 Griffin Park Dr
- 970 Bending Pine Ln
- 884 Camden Grove Cove
- 8727 Thor Rd
- 8365 Cedar Bend Cove
- 8547 Shingle Oaks Dr
- 8559 Shingle Oaks Dr
- 8550 Trinity Rd
- 8539 Shingle Oaks Dr
- 8565 Shingle Oaks Dr
- 8554 Shingle Oaks Dr
- 8560 Trinity Rd
- 8562 Shingle Oaks Dr
- 8546 Shingle Oaks Dr
- 8538 Trinity Rd
- 8538 Shingle Oaks Dr
- 8533 Shingle Oaks Dr
- 670 Radiance Dr
- 8570 Trinity Rd
- 673 Radiance Dr
- 8561 Prism Cove W
- 8525 Shingle Oaks Dr
- 8528 Trinity Rd
- 8589 Prism Cove E
- 8580 Trinity Rd