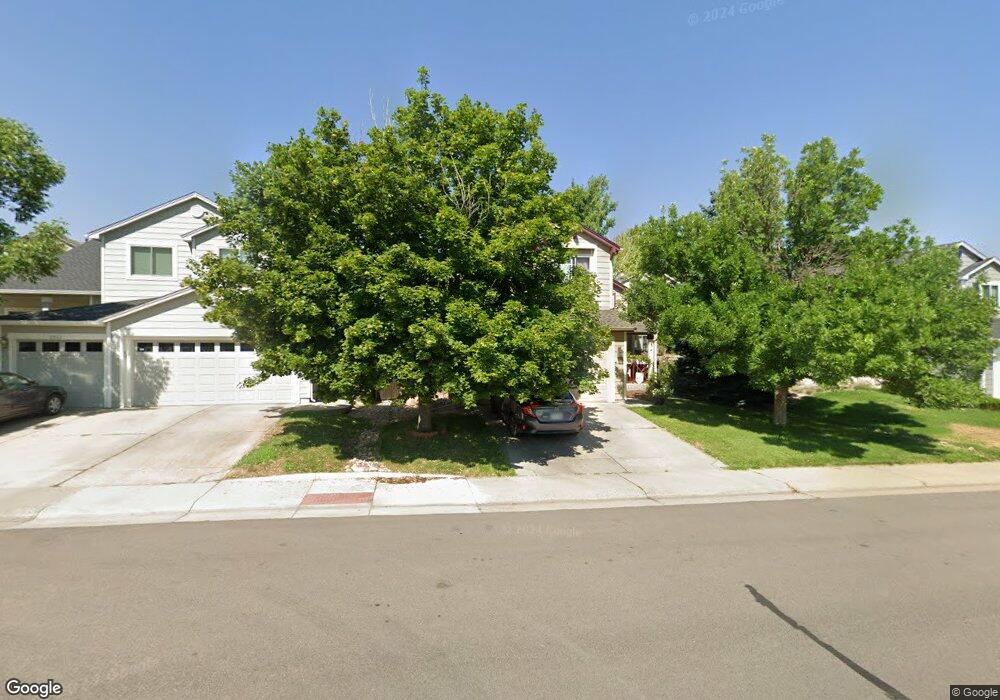
8555 Sweet Clover Way Parker, CO 80134
Cottonwood NeighborhoodEstimated Value: $517,908 - $533,000
3
Beds
3
Baths
1,312
Sq Ft
$400/Sq Ft
Est. Value
About This Home
This home is located at 8555 Sweet Clover Way, Parker, CO 80134 and is currently estimated at $524,227, approximately $399 per square foot. 8555 Sweet Clover Way is a home located in Douglas County with nearby schools including Pine Lane Elementary School, Sierra Middle School, and Chaparral High School.
Ownership History
Date
Name
Owned For
Owner Type
Purchase Details
Closed on
Jun 26, 2003
Sold by
Wagner Timothy M and Wagner Karleen L
Bought by
Gorham Charles L and Gorham Ann E
Current Estimated Value
Home Financials for this Owner
Home Financials are based on the most recent Mortgage that was taken out on this home.
Original Mortgage
$214,200
Outstanding Balance
$92,302
Interest Rate
5.44%
Mortgage Type
VA
Estimated Equity
$431,925
Purchase Details
Closed on
Apr 22, 1997
Sold by
Kaufman & Broad Of Colorado Inc
Bought by
Wagner Timothy M and Wagner Karleen L
Home Financials for this Owner
Home Financials are based on the most recent Mortgage that was taken out on this home.
Original Mortgage
$128,630
Interest Rate
7.92%
Mortgage Type
FHA
Purchase Details
Closed on
Jul 1, 1996
Sold by
Randle W Case & Mybi Partnership & M D M
Bought by
Kaufman And Broad Of Colorado
Purchase Details
Closed on
May 31, 1988
Sold by
Fimsa Inc
Bought by
Andrews Builders Inc
Create a Home Valuation Report for This Property
The Home Valuation Report is an in-depth analysis detailing your home's value as well as a comparison with similar homes in the area
Home Values in the Area
Average Home Value in this Area
Purchase History
| Date | Buyer | Sale Price | Title Company |
|---|---|---|---|
| Gorham Charles L | $210,000 | -- | |
| Wagner Timothy M | $132,281 | -- | |
| Kaufman And Broad Of Colorado | $800,000 | -- | |
| Andrews Builders Inc | $500,000 | -- |
Source: Public Records
Mortgage History
| Date | Status | Borrower | Loan Amount |
|---|---|---|---|
| Open | Gorham Charles L | $214,200 | |
| Previous Owner | Wagner Timothy M | $128,630 |
Source: Public Records
Tax History Compared to Growth
Tax History
| Year | Tax Paid | Tax Assessment Tax Assessment Total Assessment is a certain percentage of the fair market value that is determined by local assessors to be the total taxable value of land and additions on the property. | Land | Improvement |
|---|---|---|---|---|
| 2024 | $3,130 | $34,750 | $7,970 | $26,780 |
| 2023 | $3,117 | $34,750 | $7,970 | $26,780 |
| 2022 | $2,499 | $24,510 | $4,880 | $19,630 |
| 2021 | $2,596 | $24,510 | $4,880 | $19,630 |
| 2020 | $2,491 | $23,880 | $4,540 | $19,340 |
| 2019 | $2,511 | $23,880 | $4,540 | $19,340 |
| 2018 | $2,152 | $20,100 | $4,720 | $15,380 |
| 2017 | $2,057 | $20,100 | $4,720 | $15,380 |
| 2016 | $1,909 | $17,840 | $3,580 | $14,260 |
| 2015 | $2,016 | $17,840 | $3,580 | $14,260 |
| 2014 | $1,862 | $14,700 | $3,180 | $11,520 |
Source: Public Records
Map
Nearby Homes
- 8692 Wildrye Cir
- 8695 Bluebunch Ct
- 8473 Blackgum St
- 8434 Golden Eye Dr
- 8780 Rosebud Place
- 8463 Bed Straw St
- 15974 Golden Eye Ct
- 8442 Blazing Star Place
- 15936 Red Bud Dr
- 15859 Duckweed Ct
- 15892 Golden Eye Ct
- 15819 Red Bud Ct
- 8705 Cloverleaf Cir
- 16328 E Phillips Ln
- 8465 Wheatgrass Cir
- 8389 Curlycup Place
- 16919 Blue Mist Cir
- 8862 Larch Trail
- 15460 Canyon Gulch Ln Unit 202
- 15460 Canyon Gulch Ln Unit 310
- 8547 Sweet Clover Way
- 8563 Sweet Clover Way
- 8552 Bluegrass Cir
- 8546 Bluegrass Cir
- 8560 Bluegrass Cir
- 8539 Sweet Clover Way
- 8571 Sweet Clover Way
- 8552 Sweet Clover Way
- 8568 Bluegrass Cir
- 8538 Bluegrass Cir
- 8544 Sweet Clover Way
- 8568 Sweet Clover Way
- 8531 Sweet Clover Way
- 8536 Sweet Clover Way
- 8579 Sweet Clover Way
- 8532 Bluegrass Cir
- 8574 Bluegrass Cir
- 16243 Orchard Grass Ln
- 8582 Sweet Clover Way
- 8523 Sweet Clover Way