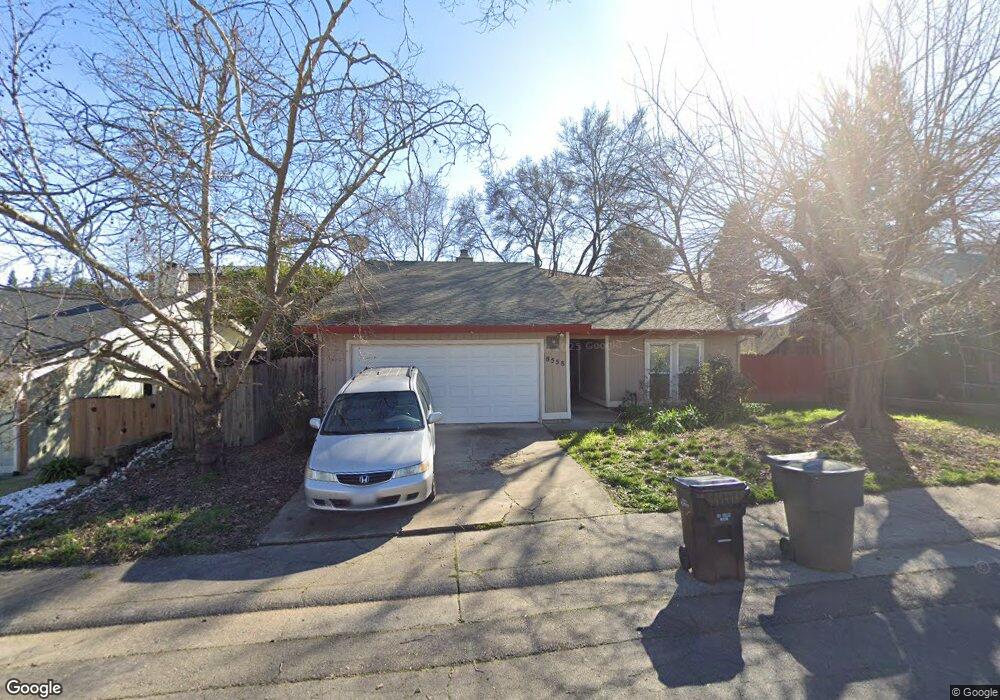
8558 Cloudcroft Way Orangevale, CA 95662
Estimated Value: $534,186 - $576,000
4
Beds
2
Baths
1,617
Sq Ft
$338/Sq Ft
Est. Value
About This Home
This home is located at 8558 Cloudcroft Way, Orangevale, CA 95662 and is currently estimated at $546,547, approximately $338 per square foot. 8558 Cloudcroft Way is a home located in Sacramento County with nearby schools including Oakview Community Elementary School, Louis Pasteur Fundamental Middle School, and Casa Roble Fundamental High School.
Ownership History
Date
Name
Owned For
Owner Type
Purchase Details
Closed on
Jan 20, 2010
Sold by
Union Pacific Mortgage Company Inc
Bought by
Eisner Patrick M
Current Estimated Value
Home Financials for this Owner
Home Financials are based on the most recent Mortgage that was taken out on this home.
Original Mortgage
$223,708
Outstanding Balance
$145,605
Interest Rate
4.78%
Mortgage Type
VA
Estimated Equity
$400,942
Purchase Details
Closed on
Aug 13, 2009
Sold by
Ozenne Dwayne M and Ozenne Julie D
Bought by
Union Pacific Mortgage Company Inc
Purchase Details
Closed on
Aug 26, 2004
Sold by
Ozenne Dwayne M and Ozenne Julie D
Bought by
Ozenne Dwayne M and Ozenne Julie D
Home Financials for this Owner
Home Financials are based on the most recent Mortgage that was taken out on this home.
Original Mortgage
$269,000
Interest Rate
8.8%
Mortgage Type
New Conventional
Create a Home Valuation Report for This Property
The Home Valuation Report is an in-depth analysis detailing your home's value as well as a comparison with similar homes in the area
Home Values in the Area
Average Home Value in this Area
Purchase History
| Date | Buyer | Sale Price | Title Company |
|---|---|---|---|
| Eisner Patrick M | $219,000 | Placer Title Company | |
| Union Pacific Mortgage Company Inc | $172,750 | None Available | |
| Ozenne Dwayne M | -- | Placer Title Company |
Source: Public Records
Mortgage History
| Date | Status | Borrower | Loan Amount |
|---|---|---|---|
| Open | Eisner Patrick M | $223,708 | |
| Previous Owner | Ozenne Dwayne M | $269,000 |
Source: Public Records
Tax History
| Year | Tax Paid | Tax Assessment Tax Assessment Total Assessment is a certain percentage of the fair market value that is determined by local assessors to be the total taxable value of land and additions on the property. | Land | Improvement |
|---|---|---|---|---|
| 2025 | $3,310 | $282,675 | $77,441 | $205,234 |
| 2024 | $3,310 | $277,133 | $75,923 | $201,210 |
| 2023 | $3,226 | $271,700 | $74,435 | $197,265 |
| 2022 | $3,208 | $266,374 | $72,976 | $193,398 |
| 2021 | $3,154 | $261,152 | $71,546 | $189,606 |
| 2020 | $3,096 | $258,475 | $70,813 | $187,662 |
| 2019 | $3,033 | $253,408 | $69,425 | $183,983 |
| 2018 | $2,994 | $248,440 | $68,064 | $180,376 |
| 2017 | $2,967 | $243,570 | $66,730 | $176,840 |
| 2016 | $2,773 | $238,795 | $65,422 | $173,373 |
| 2015 | $2,726 | $235,209 | $64,440 | $170,769 |
| 2014 | $2,668 | $230,602 | $63,178 | $167,424 |
Source: Public Records
Map
Nearby Homes
- 8641 Stratus Dr
- 8433 N Star Way
- 6051 Kenneth Oak Way
- 6219 Trajan Dr
- 8770 Greenback Ln
- 8225 Foxfire Dr
- 8631 Posadera Ave
- 6427 Wittenham Way
- 8832 Canarsie Ave
- 5555 Kamala Way
- 8497 Mallee Cir
- 8493 Mallee Cir
- 8488 Mallee Cir
- 5533 Tuckeroo Way
- 8489 Mallee Cir
- 8472 Mallee Cir
- 6113 Kifisia Way
- 8758 Corinne Dr
- 5564 Fetz Ln
- 8483 Wattle Way
- 8564 Cloudcroft Way
- 8552 Cloudcroft Way
- 8555 Heather Cross Way
- 8551 Heather Cross Way
- 8559 Heather Cross Way
- 8542 Cloudcroft Way
- 8559 Cloudcroft Way
- 8600 Stratus Dr
- 8606 Stratus Dr
- 8547 Heather Cross Way
- 8553 Cloudcroft Way
- 8612 Stratus Dr
- 8536 Cloudcroft Way
- 8588 Stratus Dr
- 8543 Cloudcroft Way
- 8543 Heather Cross Way
- 8618 Stratus Dr
- 8582 Stratus Dr
- 8532 Cloudcroft Way
- 8624 Stratus Dr
Your Personal Tour Guide
Ask me questions while you tour the home.