856 Acorn Way Unit 53 Napa, CA 94558
Silverado Resort NeighborhoodEstimated Value: $1,159,000 - $1,774,000
3
Beds
2
Baths
1,301
Sq Ft
$1,176/Sq Ft
Est. Value
About This Home
This home is located at 856 Acorn Way Unit 53, Napa, CA 94558 and is currently estimated at $1,529,607, approximately $1,175 per square foot. 856 Acorn Way Unit 53 is a home located in Napa County with nearby schools including Vichy Elementary School, Silverado Middle School, and Vintage High School.
Ownership History
Date
Name
Owned For
Owner Type
Purchase Details
Closed on
Apr 12, 2005
Sold by
Magnuson Richard A and Magnuson Allison L
Bought by
Brod Norman B and Brod Margaret Mary
Current Estimated Value
Purchase Details
Closed on
Mar 24, 2005
Sold by
Brod Norman B and Brod Margaret Mary
Bought by
Brod Norman Bernard and Andrews Peggy
Purchase Details
Closed on
Nov 13, 2002
Sold by
Magnuson Rick and Magnuson Allison
Bought by
Magnuson Richard A and Magnuson Allison L
Home Financials for this Owner
Home Financials are based on the most recent Mortgage that was taken out on this home.
Original Mortgage
$250,000
Interest Rate
4.87%
Purchase Details
Closed on
Jan 7, 1998
Sold by
Kerson Grace and Kerson Donald L
Bought by
Magnuson Rick and Magnuson Allison
Home Financials for this Owner
Home Financials are based on the most recent Mortgage that was taken out on this home.
Original Mortgage
$210,000
Interest Rate
7.16%
Create a Home Valuation Report for This Property
The Home Valuation Report is an in-depth analysis detailing your home's value as well as a comparison with similar homes in the area
Home Values in the Area
Average Home Value in this Area
Purchase History
| Date | Buyer | Sale Price | Title Company |
|---|---|---|---|
| Brod Norman B | $725,000 | First Amer Title Co Of Napa | |
| Brod Norman Bernard | -- | First Amer Title Co Of Napa | |
| Magnuson Richard A | -- | Commonwealth Land Title Co | |
| Magnuson Rick | $360,000 | First American Title Co |
Source: Public Records
Mortgage History
| Date | Status | Borrower | Loan Amount |
|---|---|---|---|
| Previous Owner | Magnuson Richard A | $250,000 | |
| Previous Owner | Magnuson Rick | $210,000 |
Source: Public Records
Tax History
| Year | Tax Paid | Tax Assessment Tax Assessment Total Assessment is a certain percentage of the fair market value that is determined by local assessors to be the total taxable value of land and additions on the property. | Land | Improvement |
|---|---|---|---|---|
| 2025 | $11,903 | $997,266 | $592,404 | $404,862 |
| 2024 | $11,528 | $977,713 | $580,789 | $396,924 |
| 2023 | $11,528 | $958,543 | $569,401 | $389,142 |
| 2022 | $11,214 | $939,749 | $558,237 | $381,512 |
| 2021 | $11,076 | $921,324 | $547,292 | $374,032 |
| 2020 | $11,014 | $911,878 | $541,681 | $370,197 |
| 2019 | $10,802 | $893,999 | $531,060 | $362,939 |
| 2018 | $10,669 | $876,471 | $520,648 | $355,823 |
| 2017 | $10,459 | $859,287 | $510,440 | $348,847 |
| 2016 | $9,787 | $800,000 | $425,000 | $375,000 |
| 2015 | $7,119 | $600,000 | $325,000 | $275,000 |
| 2014 | $6,960 | $583,275 | $315,000 | $268,275 |
Source: Public Records
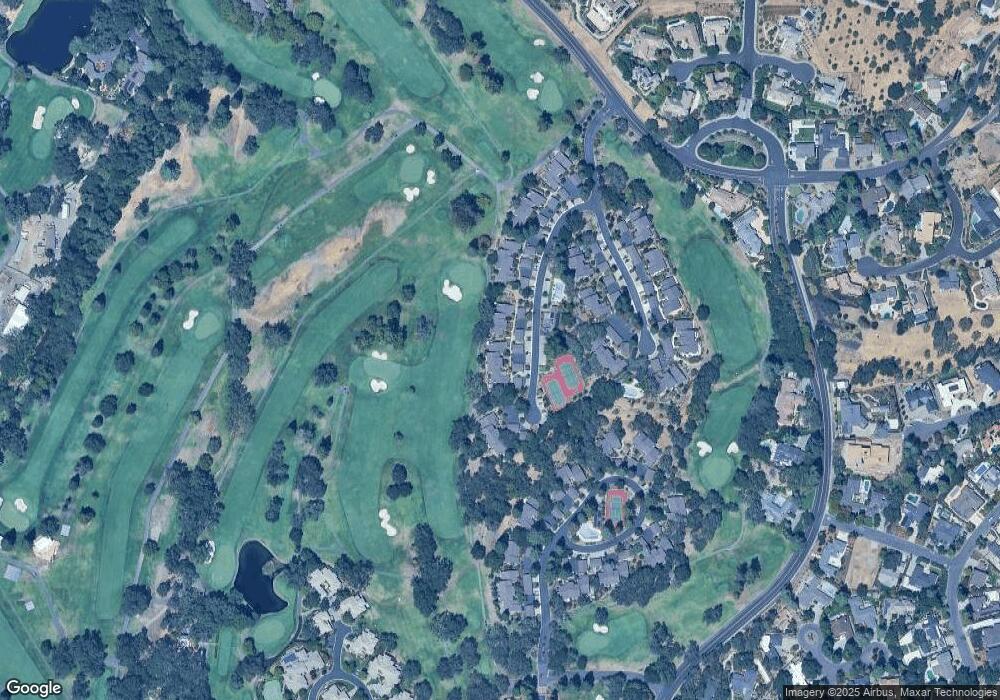
Map
Nearby Homes
- 868 Oak Leaf Way
- 808 Augusta Cir
- 833 Augusta Cir Unit 34
- 14 Maui Way
- 19 Inverness Dr
- 350 Deer Hollow Dr
- 389 Saint Andrews Dr
- 1166 Castle Oaks Dr
- 1161 Castle Oaks Dr
- 2186 Monticello Rd
- 162 Bonnie Brook Dr
- 540 Westgate Dr
- 23 Saint Michael Cir
- 1150 Castle Oaks Dr
- 1143 Castle Oaks Dr
- 548 Westgate Dr
- 421 Bear Creek Cir
- 1600 Atlas Peak Rd Unit 383-4
- 2277 Monticello Rd
- 377 Troon Dr
- 857 Acorn Way Unit 54
- 858 Acorn Way Unit 55
- 861 Acorn Way
- 860 Acorn Way
- 859 Acorn Way
- 855 Acorn Way
- 853 Acorn Way
- 852 Acorn Way
- 854 Acorn Way Unit 51
- 851 Acorn Way
- 862 Acorn Way Unit 59
- 891 Oak Leaf Way
- 890 Oak Leaf Way
- 889 Oak Leaf Way
- 863 Acorn Way
- 846 Acorn Way
- 849 Acorn Way Unit 46
- 893 Oak Leaf Way
- 894 Oak Leaf Way
- 895 Oak Leaf Way Unit 28
Your Personal Tour Guide
Ask me questions while you tour the home.