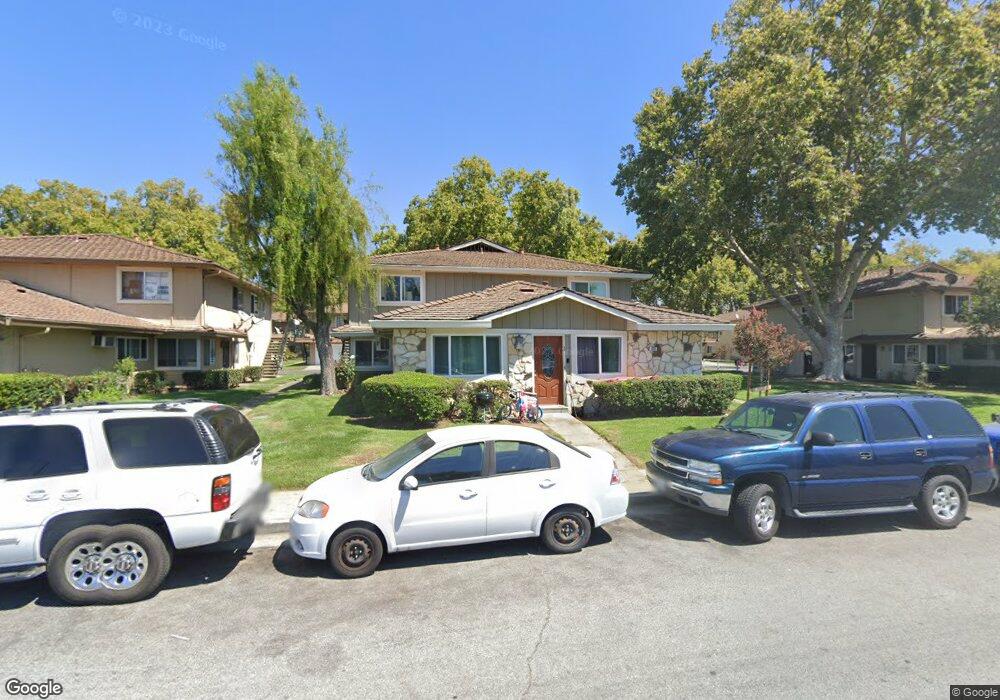
856 Gilchrist Dr Unit 2 San Jose, CA 95133
Penitencia NeighborhoodEstimated Value: $504,648 - $634,000
2
Beds
1
Bath
903
Sq Ft
$608/Sq Ft
Est. Value
About This Home
This home is located at 856 Gilchrist Dr Unit 2, San Jose, CA 95133 and is currently estimated at $549,412, approximately $608 per square foot. 856 Gilchrist Dr Unit 2 is a home located in Santa Clara County with nearby schools including Summerdale Elementary School, Piedmont Middle School, and Independence High School.
Ownership History
Date
Name
Owned For
Owner Type
Purchase Details
Closed on
May 12, 2022
Sold by
Mena Alma R
Bought by
Avila Jose B
Current Estimated Value
Purchase Details
Closed on
Mar 22, 2002
Sold by
Avila Jose B and Mena Alma R
Bought by
Avila Jose B and Mena Alma R
Purchase Details
Closed on
May 13, 1998
Sold by
Nguyen Tien Hung and Vo Annie
Bought by
Avila Jose R and Mena Alma R
Home Financials for this Owner
Home Financials are based on the most recent Mortgage that was taken out on this home.
Original Mortgage
$126,550
Interest Rate
7.07%
Mortgage Type
FHA
Purchase Details
Closed on
Jun 5, 1996
Sold by
Wells Fargo Bank Na
Bought by
Nguyen Tien Hung and Vo Annie
Home Financials for this Owner
Home Financials are based on the most recent Mortgage that was taken out on this home.
Original Mortgage
$69,200
Interest Rate
8.25%
Mortgage Type
FHA
Purchase Details
Closed on
Jan 11, 1996
Sold by
Luu Uy and Wells Fargo Bank
Bought by
Wells Fargo Bank
Create a Home Valuation Report for This Property
The Home Valuation Report is an in-depth analysis detailing your home's value as well as a comparison with similar homes in the area
Home Values in the Area
Average Home Value in this Area
Purchase History
| Date | Buyer | Sale Price | Title Company |
|---|---|---|---|
| Avila Jose B | -- | None Listed On Document | |
| Avila Jose B | -- | Fidelity National Title Ins | |
| Avila Jose B | -- | Fidelity National Title Ins | |
| Avila Jose R | $131,000 | Fidelity National Title Co | |
| Nguyen Tien Hung | $86,500 | Fidelity National Title Co | |
| Wells Fargo Bank | $81,000 | Fidelity National Title Ins |
Source: Public Records
Mortgage History
| Date | Status | Borrower | Loan Amount |
|---|---|---|---|
| Previous Owner | Avila Jose R | $126,550 | |
| Previous Owner | Nguyen Tien Hung | $69,200 |
Source: Public Records
Tax History Compared to Growth
Tax History
| Year | Tax Paid | Tax Assessment Tax Assessment Total Assessment is a certain percentage of the fair market value that is determined by local assessors to be the total taxable value of land and additions on the property. | Land | Improvement |
|---|---|---|---|---|
| 2025 | $5,198 | $375,168 | $177,125 | $198,043 |
| 2024 | $5,198 | $367,812 | $173,652 | $194,160 |
| 2023 | $5,192 | $360,601 | $170,248 | $190,353 |
| 2022 | $3,089 | $197,083 | $78,829 | $118,254 |
| 2021 | $2,987 | $193,220 | $77,284 | $115,936 |
| 2020 | $2,922 | $191,240 | $76,492 | $114,748 |
| 2019 | $2,822 | $187,492 | $74,993 | $112,499 |
| 2018 | $2,783 | $183,817 | $73,523 | $110,294 |
| 2017 | $2,794 | $180,214 | $72,082 | $108,132 |
| 2016 | $2,670 | $176,681 | $70,669 | $106,012 |
| 2015 | $2,631 | $174,028 | $69,608 | $104,420 |
| 2014 | $2,483 | $170,620 | $68,245 | $102,375 |
Source: Public Records
Map
Nearby Homes
- 825 N Capitol Ave Unit 4
- 985 Harcot Ct
- 990 Harcot Ct
- 981 Harcot Ct
- 997 Harcot Ct
- 994 Harcot Ct
- 970 E Harcot Ct
- 982 Harcot Ct
- 998 Harcot Ct
- Residence 2 Plan at Ascend
- Residence 1 Plan at Ascend
- Residence 3 Plan at Ascend
- 2714 Mabury Square
- 714 N Capitol Ave
- 674 Galleon Ct
- 1055 N Capitol Ave Unit 124
- 1055 N Capitol Ave Unit 180
- 1055 N Capitol Ave Unit 51
- 709 Whitewater Ct Unit 44
- 2806 Glauser Dr
- 856 Gilchrist Dr Unit 4
- 856 Gilchrist Dr Unit 3
- 856 Gilchrist Dr Unit 1
- 866 Gilchrist Dr Unit 2
- 866 Gilchrist Dr Unit 1
- 866 Gilchrist Dr Unit 4
- 866 Gilchrist Dr Unit 3
- 840 Gilchrist Dr Unit 3
- 840 Gilchrist Dr Unit 4
- 840 Gilchrist Dr Unit 3
- 840 Gilchrist Dr Unit 2
- 840 Gilchrist Dr Unit 1
- 853 Gilchrist Walkway
- 853 Gilchrist Dr Unit 2
- 853 Gilchrist Walkway Unit 1
- 853 Gilchrist Walkway Unit 2
- 853 Gilchrist Walkway Unit 3
- 853 Gilchrist Walkway Unit 4
- 839 Gilchrist Walkway Unit 4
- 839 Gilchrist Walkway Unit 3