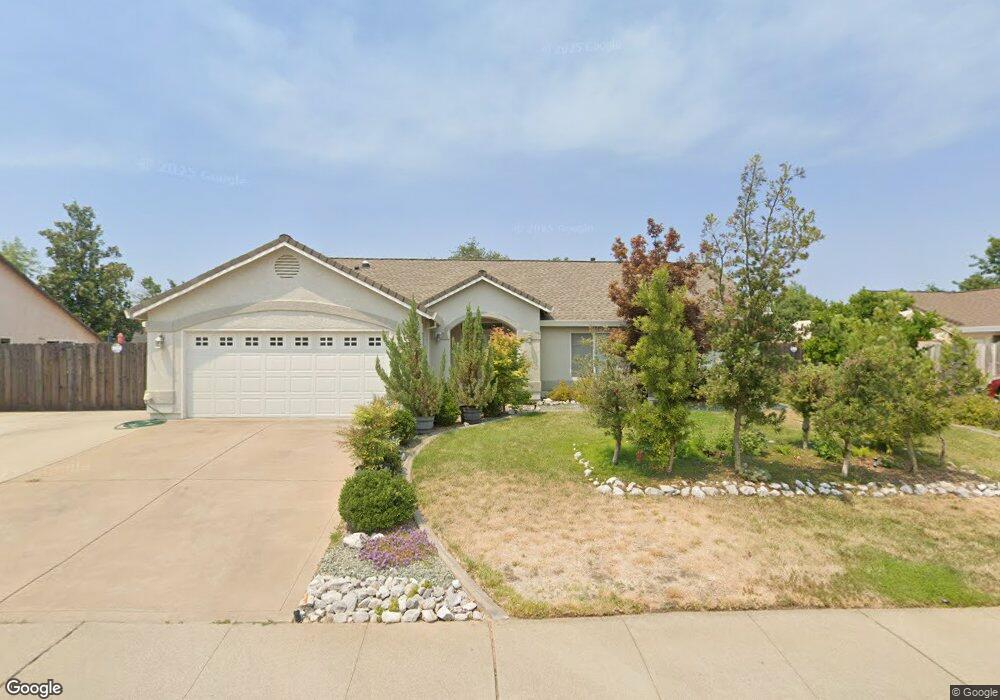
856 Paramount Way Redding, CA 96003
Hawley NeighborhoodEstimated Value: $380,025 - $414,000
3
Beds
2
Baths
1,758
Sq Ft
$227/Sq Ft
Est. Value
About This Home
This home is located at 856 Paramount Way, Redding, CA 96003 and is currently estimated at $399,506, approximately $227 per square foot. 856 Paramount Way is a home located in Shasta County with nearby schools including Shasta View Academy, Bethel Christian School, and Country Christian School.
Ownership History
Date
Name
Owned For
Owner Type
Purchase Details
Closed on
Jul 10, 2007
Sold by
Hill Dennis D and Hill Jean Ellen
Bought by
Hill Dennis D and Hill Jean E
Current Estimated Value
Purchase Details
Closed on
Jan 22, 2003
Sold by
Casey Brett D and Casey Danna C
Bought by
Hill Dennis D and Hill Jean Ellen
Purchase Details
Closed on
Jan 7, 2000
Sold by
Meyer William J and Meyer Joanne E
Bought by
Casey Brett D and Casey Danna C
Purchase Details
Closed on
Dec 14, 1998
Sold by
Graves James G and Graves Judy
Bought by
Meyer William J and Meyer Joanne E
Home Financials for this Owner
Home Financials are based on the most recent Mortgage that was taken out on this home.
Original Mortgage
$138,136
Interest Rate
6.82%
Mortgage Type
FHA
Create a Home Valuation Report for This Property
The Home Valuation Report is an in-depth analysis detailing your home's value as well as a comparison with similar homes in the area
Home Values in the Area
Average Home Value in this Area
Purchase History
| Date | Buyer | Sale Price | Title Company |
|---|---|---|---|
| Hill Dennis D | -- | None Available | |
| Hill Dennis D | $229,000 | Placer Title Company | |
| Casey Brett D | -- | Placer Title Company | |
| Meyer William J | $140,000 | Fidelity National Title Co |
Source: Public Records
Mortgage History
| Date | Status | Borrower | Loan Amount |
|---|---|---|---|
| Previous Owner | Meyer William J | $138,136 |
Source: Public Records
Tax History
| Year | Tax Paid | Tax Assessment Tax Assessment Total Assessment is a certain percentage of the fair market value that is determined by local assessors to be the total taxable value of land and additions on the property. | Land | Improvement |
|---|---|---|---|---|
| 2025 | $2,151 | $194,665 | $39,217 | $155,448 |
| 2024 | $2,109 | $190,849 | $38,449 | $152,400 |
| 2023 | $2,109 | $187,108 | $37,696 | $149,412 |
| 2022 | $2,045 | $183,440 | $36,957 | $146,483 |
| 2021 | $2,041 | $179,844 | $36,233 | $143,611 |
| 2020 | $2,011 | $178,001 | $35,862 | $142,139 |
| 2019 | $1,949 | $174,511 | $35,159 | $139,352 |
| 2018 | $1,970 | $171,090 | $34,470 | $136,620 |
| 2017 | $1,936 | $167,737 | $33,795 | $133,942 |
| 2016 | $1,854 | $164,449 | $33,133 | $131,316 |
| 2015 | $1,824 | $161,980 | $32,636 | $129,344 |
| 2014 | $1,830 | $158,808 | $31,997 | $126,811 |
Source: Public Records
Map
Nearby Homes
- 19424 Posey Ln
- 1102 Hope Ln
- 19219 Nike Ct
- 61 Tidmore Ln
- 11632 Ridgewood Rd
- 19340 Carnegie Ct
- 2192 Princeton Way
- 2199 Princeton Way
- 332 Franciscan Trail
- 948 & 950 Hawley
- 5961 Sierra Dr
- 1546 Gold Hills Dr
- 5976 Sierra Dr
- 662 Ansley Ct
- 2182 Cadjew St
- 2110 Cadjew St
- 2134 Cadjew St
- 550 Armando Ave
- 450 Country Oak Dr
- 5890 Shadow Glen Dr
- 868 Paramount Way Unit 2
- 844 Paramount Way
- 820 Paramount Way
- 863 Paramount Way
- 19361 Posey Ln
- 880 Paramount Way Unit 2
- 873 Paramount Way
- 0 Paramount Lot 2
- 11 Paramount Way Unit 11
- 12 Paramount Way
- 808 Paramount Way
- 883 Paramount Way
- 802 Cally Ct
- 803 Paramount Way
- 839 Rincon Way
- 823 Paramount Way Unit 8
- 823 Paramount Way
- 843 Paramount Way
- 892 Paramount Way
- 19343 Posey Ln
Your Personal Tour Guide
Ask me questions while you tour the home.