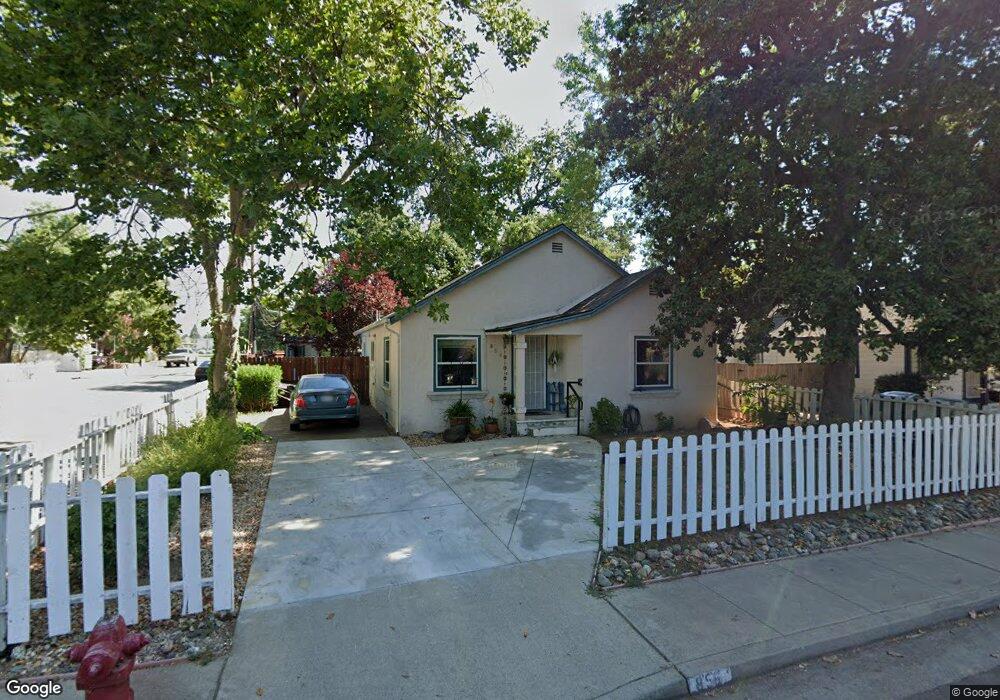
856 State St Redding, CA 96001
Parkview NeighborhoodEstimated Value: $227,000 - $272,000
3
Beds
1
Bath
1,122
Sq Ft
$219/Sq Ft
Est. Value
About This Home
This home is located at 856 State St, Redding, CA 96001 and is currently estimated at $245,278, approximately $218 per square foot. 856 State St is a home located in Shasta County with nearby schools including Juniper, Sequoia Middle School, and Shasta High School.
Ownership History
Date
Name
Owned For
Owner Type
Purchase Details
Closed on
Dec 12, 2016
Sold by
Hunt Elaine L
Bought by
Hunt Elaine L and Elgin Rhonda R
Current Estimated Value
Purchase Details
Closed on
Jan 26, 2010
Sold by
Federal National Mortgage Association
Bought by
Hunt Elaine L
Home Financials for this Owner
Home Financials are based on the most recent Mortgage that was taken out on this home.
Original Mortgage
$92,000
Outstanding Balance
$60,888
Interest Rate
5.03%
Mortgage Type
New Conventional
Estimated Equity
$184,390
Purchase Details
Closed on
Oct 13, 2009
Sold by
Robbings Brian A and Robbings Colleen M
Bought by
Federal National Mortgage Association
Create a Home Valuation Report for This Property
The Home Valuation Report is an in-depth analysis detailing your home's value as well as a comparison with similar homes in the area
Home Values in the Area
Average Home Value in this Area
Purchase History
| Date | Buyer | Sale Price | Title Company |
|---|---|---|---|
| Hunt Elaine L | -- | None Available | |
| Hunt Elaine L | $115,000 | Fidelity National Title Co | |
| Federal National Mortgage Association | $176,618 | First American Title Ins Co |
Source: Public Records
Mortgage History
| Date | Status | Borrower | Loan Amount |
|---|---|---|---|
| Open | Hunt Elaine L | $92,000 |
Source: Public Records
Tax History
| Year | Tax Paid | Tax Assessment Tax Assessment Total Assessment is a certain percentage of the fair market value that is determined by local assessors to be the total taxable value of land and additions on the property. | Land | Improvement |
|---|---|---|---|---|
| 2025 | $1,486 | $148,431 | $45,171 | $103,260 |
| 2024 | $1,461 | $145,522 | $44,286 | $101,236 |
| 2023 | $1,461 | $142,669 | $43,418 | $99,251 |
| 2022 | $1,435 | $139,872 | $42,567 | $97,305 |
| 2021 | $1,426 | $137,131 | $41,733 | $95,398 |
| 2020 | $1,443 | $135,726 | $41,306 | $94,420 |
| 2019 | $1,369 | $133,066 | $40,497 | $92,569 |
| 2018 | $1,380 | $130,457 | $39,703 | $90,754 |
| 2017 | $1,371 | $127,900 | $38,925 | $88,975 |
| 2016 | $1,267 | $120,000 | $35,000 | $85,000 |
| 2015 | $1,226 | $116,000 | $40,000 | $76,000 |
| 2014 | $1,241 | $116,000 | $40,000 | $76,000 |
Source: Public Records
Map
Nearby Homes
- 745 Parkview Ave
- 1012 State St
- 864 Kite Ln
- 2514 California St
- 2405 Cliff Dr
- 815 Locust St
- 351 Weldon St
- 2239 Garden Ave
- 3244 Veda St
- 2123 Waldon St
- 1005 Gold St
- 2590 Henderson Rd
- 3443 West St
- 2056 Canal Dr
- 350 Park Marina Cir
- 649 Lowe St
- 0 California St Unit 25-5331
- 1868 Gold St
- 2050 Skyline Dr
- 3024 West St
Your Personal Tour Guide
Ask me questions while you tour the home.