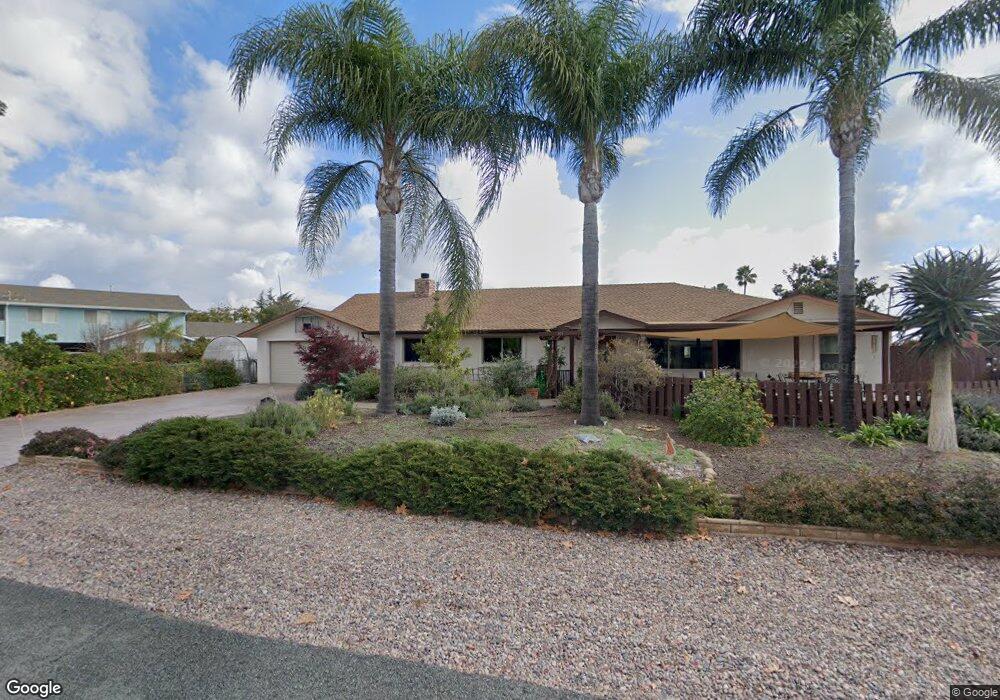
857 Sharon Way El Cajon, CA 92020
Fletcher Hills NeighborhoodEstimated Value: $1,091,981 - $1,245,000
5
Beds
3
Baths
2,368
Sq Ft
$490/Sq Ft
Est. Value
About This Home
This home is located at 857 Sharon Way, El Cajon, CA 92020 and is currently estimated at $1,160,995, approximately $490 per square foot. 857 Sharon Way is a home located in San Diego County with nearby schools including Fletcher Hills Elementary School, Parkway Academy, and West Hills High School.
Ownership History
Date
Name
Owned For
Owner Type
Purchase Details
Closed on
Dec 30, 2014
Sold by
Mclees James B and Mclees Nancy E
Bought by
Mclees Declaration Of Trust and Mclees Nancy E
Current Estimated Value
Purchase Details
Closed on
Aug 24, 2011
Sold by
Mclees Nancy E
Bought by
Mclees James B and Mc Lees Nancy E
Home Financials for this Owner
Home Financials are based on the most recent Mortgage that was taken out on this home.
Original Mortgage
$150,000
Interest Rate
4.26%
Mortgage Type
New Conventional
Purchase Details
Closed on
Nov 3, 2008
Sold by
Mclees Nancy E
Bought by
Mclees Nancy E
Purchase Details
Closed on
Feb 21, 2005
Sold by
Gooden Kenneth E
Bought by
Gooden Kenneth E
Purchase Details
Closed on
Aug 14, 1987
Create a Home Valuation Report for This Property
The Home Valuation Report is an in-depth analysis detailing your home's value as well as a comparison with similar homes in the area
Home Values in the Area
Average Home Value in this Area
Purchase History
| Date | Buyer | Sale Price | Title Company |
|---|---|---|---|
| Mclees Declaration Of Trust | -- | None Available | |
| Mclees James B | -- | First American Equity Loan S | |
| Mclees Nancy E | -- | None Available | |
| Gooden Kenneth E | -- | -- | |
| Gooden Kenneth E | $200,000 | -- | |
| -- | $180,000 | -- |
Source: Public Records
Mortgage History
| Date | Status | Borrower | Loan Amount |
|---|---|---|---|
| Previous Owner | Mclees James B | $150,000 |
Source: Public Records
Tax History
| Year | Tax Paid | Tax Assessment Tax Assessment Total Assessment is a certain percentage of the fair market value that is determined by local assessors to be the total taxable value of land and additions on the property. | Land | Improvement |
|---|---|---|---|---|
| 2025 | $5,182 | $364,697 | $143,538 | $221,159 |
| 2024 | $5,182 | $357,547 | $140,724 | $216,823 |
| 2023 | $4,964 | $350,537 | $137,965 | $212,572 |
| 2022 | $5,733 | $343,664 | $135,260 | $208,404 |
| 2021 | $5,540 | $336,926 | $132,608 | $204,318 |
| 2020 | $4,841 | $333,472 | $131,249 | $202,223 |
| 2019 | $3,745 | $326,934 | $128,676 | $198,258 |
| 2018 | $3,747 | $320,524 | $126,153 | $194,371 |
| 2017 | $3,693 | $314,240 | $123,680 | $190,560 |
| 2016 | $3,573 | $308,079 | $121,255 | $186,824 |
| 2015 | $3,548 | $303,452 | $119,434 | $184,018 |
| 2014 | $3,478 | $297,509 | $117,095 | $180,414 |
Source: Public Records
Map
Nearby Homes
- 874 Hacienda Dr
- 812 Sharon Way
- 700 Wakefield Ct
- 2524 Seattle Dr
- 2532 Seattle Dr
- 2698 Carlow St
- 2529 Littleton Rd
- 0 Hacienda Dr
- 1787 Galway Place
- 1676 Vann Ct
- 905 Loma Ct
- 933 Eastside Rd
- 1217 Pfeifer Ln
- 1245 Eastside Rd
- 296 Southern Rd
- 731 Dewane Dr
- 1381 Partridge Ave Unit 2
- 1387 Weers St
- 1894 Wedgemere Rd
- 1509 Honey Hill Rd
- 835 Sharon Way
- 897 Sharon Way
- 870 Hacienda Dr
- 866 Hacienda Dr
- 819 Sharon Way Unit 2
- 848 Hacienda Dr
- 862 Sharon Way
- 880 Hacienda Dr
- 874 Sharon Way
- 927 Sharon Way
- 852 Sharon Way
- 797 Sharon Way
- 828 Sharon Way
- 848 Sharon Way
- 832 Hacienda Dr
- 886 Hacienda Dr
- 910 Sharon Way
- 875 Hacienda Dr
- 835 Hacienda Dr
- 953 Sharon Way
Your Personal Tour Guide
Ask me questions while you tour the home.