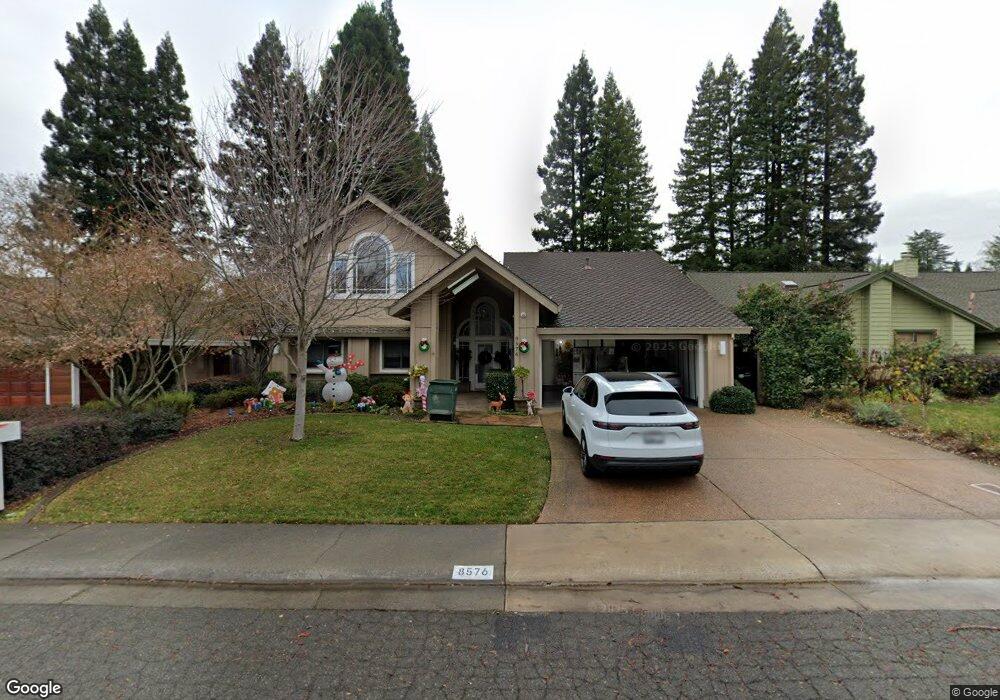
8576 Via Gwynn Way Fair Oaks, CA 95628
Estimated Value: $649,000 - $968,000
4
Beds
4
Baths
4,219
Sq Ft
$200/Sq Ft
Est. Value
About This Home
This home is located at 8576 Via Gwynn Way, Fair Oaks, CA 95628 and is currently estimated at $845,656, approximately $200 per square foot. 8576 Via Gwynn Way is a home located in Sacramento County with nearby schools including Earl Legette Elementary School, Andrew Carnegie Middle School, and Bella Vista High School.
Ownership History
Date
Name
Owned For
Owner Type
Purchase Details
Closed on
May 25, 2021
Sold by
Terry And Lori Street Family Trust and Street Terence John
Bought by
Terry And Lori Street Family Trust and Street
Current Estimated Value
Purchase Details
Closed on
Nov 26, 2012
Sold by
Street Terence J and Street Lori S
Bought by
Street Terence J and Street Lori S
Home Financials for this Owner
Home Financials are based on the most recent Mortgage that was taken out on this home.
Original Mortgage
$322,400
Interest Rate
2.75%
Mortgage Type
New Conventional
Purchase Details
Closed on
Feb 12, 2007
Sold by
Street Terence J and Street Lori S
Bought by
Street Terence J and Street Lori S
Create a Home Valuation Report for This Property
The Home Valuation Report is an in-depth analysis detailing your home's value as well as a comparison with similar homes in the area
Home Values in the Area
Average Home Value in this Area
Purchase History
| Date | Buyer | Sale Price | Title Company |
|---|---|---|---|
| Terry And Lori Street Family Trust | -- | None Listed On Document | |
| Terry And Lori Street Family Trust | -- | None Listed On Document | |
| Street Terence J | -- | First American Title Company | |
| Street Terence J | -- | First American Title Co | |
| Street Terence J | -- | None Available |
Source: Public Records
Mortgage History
| Date | Status | Borrower | Loan Amount |
|---|---|---|---|
| Previous Owner | Street Terence J | $322,400 |
Source: Public Records
Tax History Compared to Growth
Tax History
| Year | Tax Paid | Tax Assessment Tax Assessment Total Assessment is a certain percentage of the fair market value that is determined by local assessors to be the total taxable value of land and additions on the property. | Land | Improvement |
|---|---|---|---|---|
| 2025 | $4,907 | $411,397 | $62,134 | $349,263 |
| 2024 | $4,907 | $403,331 | $60,916 | $342,415 |
| 2023 | $4,763 | $395,423 | $59,722 | $335,701 |
| 2022 | $4,744 | $387,670 | $58,551 | $329,119 |
| 2021 | $4,635 | $380,069 | $57,403 | $322,666 |
| 2020 | $4,568 | $376,173 | $56,815 | $319,358 |
| 2019 | $4,451 | $368,798 | $55,701 | $313,097 |
| 2018 | $4,351 | $361,567 | $54,609 | $306,958 |
| 2017 | $4,306 | $354,479 | $53,539 | $300,940 |
| 2016 | $4,022 | $347,530 | $52,490 | $295,040 |
| 2015 | $3,952 | $342,311 | $51,702 | $290,609 |
| 2014 | $3,867 | $335,607 | $50,690 | $284,917 |
Source: Public Records
Map
Nearby Homes
- 5312 Cabodi Ct
- 5338 Cozby Ct
- 8676 Gunner Way
- 8576 Hilton Way
- 5137 Kenneth Ave
- 8461 Caslan Ave
- 8654 Fairmont Way
- 8514 Bordeaux Way
- 5302 Illinois Ave
- 8486 Wattle Way
- 8490 Wattle Way
- 8482 Wattle Way
- 8478 Wattle Way
- 8474 Wattle Way
- 8483 Wattle Way
- 8470 Wattle Way
- 8479 Wattle Way
- 8466 Wattle Way
- 8475 Wattle Way
- 5340 Nelle Place
- 8572 Via Gwynn Way
- 8580 Via Gwynn Way
- 5223 Blossomwood Ct
- 8564 Via Gwynn Way
- 5229 Blossomwood Ct
- 5217 Blossomwood Ct
- 8575 Via Gwynn Way
- 8581 Via Gwynn Way
- 8558 Via Gwynn Way
- 8573 Phoenix Ave
- 8565 Via Gwynn Way
- 8585 Via Gwynn Way
- 5211 Blossomwood Ct
- 8559 Phoenix Ave
- 5300 Cabodi Ct
- 8552 Via Gwynn Way
- 5224 Blossomwood Ct
- 5230 Blossomwood Ct
- 5301 Cabodi Ct
- 5301 Roper Ave