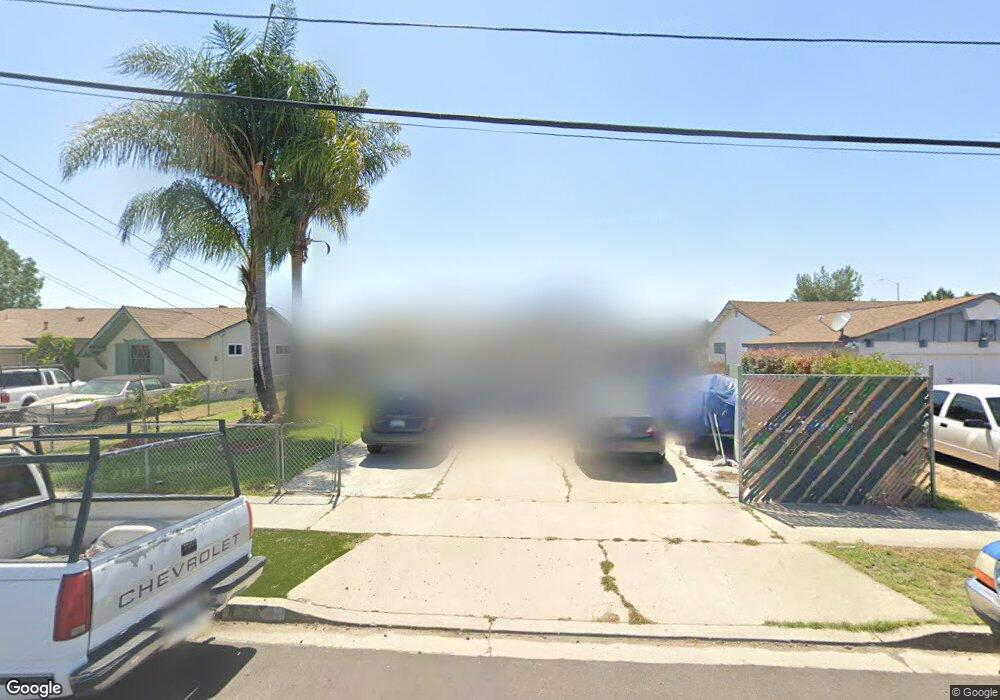
858 Safford Ave Spring Valley, CA 91977
Estimated Value: $670,274 - $765,000
3
Beds
2
Baths
1,170
Sq Ft
$611/Sq Ft
Est. Value
About This Home
This home is located at 858 Safford Ave, Spring Valley, CA 91977 and is currently estimated at $714,319, approximately $610 per square foot. 858 Safford Ave is a home located in San Diego County with nearby schools including Science, Technology, Engineering, Arts, And Math Academy, Kempton Literacy Academy, and Mount Miguel High School.
Ownership History
Date
Name
Owned For
Owner Type
Purchase Details
Closed on
Oct 16, 2001
Sold by
Four D Properties Inc
Bought by
Garcia Martin
Current Estimated Value
Home Financials for this Owner
Home Financials are based on the most recent Mortgage that was taken out on this home.
Original Mortgage
$186,572
Interest Rate
6.51%
Mortgage Type
FHA
Purchase Details
Closed on
Jun 10, 1997
Sold by
Smith Daniel R
Bought by
Four D Corp
Purchase Details
Closed on
May 9, 1994
Sold by
Sabin Raymond D
Bought by
Capital Investment Group Inc
Purchase Details
Closed on
Jul 30, 1993
Sold by
Smith Daniel R
Bought by
Sabin Raymond D
Home Financials for this Owner
Home Financials are based on the most recent Mortgage that was taken out on this home.
Original Mortgage
$9,800
Interest Rate
7.34%
Mortgage Type
Seller Take Back
Purchase Details
Closed on
Dec 16, 1992
Create a Home Valuation Report for This Property
The Home Valuation Report is an in-depth analysis detailing your home's value as well as a comparison with similar homes in the area
Home Values in the Area
Average Home Value in this Area
Purchase History
| Date | Buyer | Sale Price | Title Company |
|---|---|---|---|
| Garcia Martin | $189,500 | Old Republic Title Company | |
| Four D Corp | -- | -- | |
| Capital Investment Group Inc | -- | -- | |
| Sabin Raymond D | -- | Union Land Title Co | |
| -- | $138,000 | -- |
Source: Public Records
Mortgage History
| Date | Status | Borrower | Loan Amount |
|---|---|---|---|
| Previous Owner | Garcia Martin | $186,572 | |
| Previous Owner | Sabin Raymond D | $9,800 |
Source: Public Records
Tax History
| Year | Tax Paid | Tax Assessment Tax Assessment Total Assessment is a certain percentage of the fair market value that is determined by local assessors to be the total taxable value of land and additions on the property. | Land | Improvement |
|---|---|---|---|---|
| 2025 | $3,793 | $279,928 | $139,964 | $139,964 |
| 2024 | $3,793 | $274,440 | $137,220 | $137,220 |
| 2023 | $3,669 | $269,060 | $134,530 | $134,530 |
| 2022 | $3,602 | $263,786 | $131,893 | $131,893 |
| 2021 | $3,569 | $258,614 | $129,307 | $129,307 |
| 2020 | $3,422 | $255,964 | $127,982 | $127,982 |
| 2019 | $3,370 | $250,946 | $125,473 | $125,473 |
| 2018 | $3,259 | $246,026 | $123,013 | $123,013 |
| 2017 | $830 | $241,202 | $120,601 | $120,601 |
| 2016 | $3,051 | $236,474 | $118,237 | $118,237 |
| 2015 | $3,024 | $232,922 | $116,461 | $116,461 |
| 2014 | $2,970 | $228,360 | $114,180 | $114,180 |
Source: Public Records
Map
Nearby Homes
- 8766 Kelso St
- 753 Elkelton Blvd
- 948 Gillespie Dr
- 1145 Helix St Unit 1
- 8838 Innsdale Ave
- 1034 Leland St Unit 14
- 557 Parkbrook St
- 738 Carlsbad St
- 524 Parkbrook St
- 1265 Darby St
- 732 Worthington St
- 463 Parkbrook St
- 342 Billow Dr
- 8644 Eileen St
- 612 Cardiff St
- 517 Worthington St
- 903 Concepcion Ave
- 661 Concepcion Ave
- 9125 Akard St
- 9258 Birch St
- 850 Safford Ave
- 866 Safford Ave
- 842 Safford Ave
- 8707 Saint George St
- 8704 Hiel St
- 834 Safford Ave
- 8715 Saint George St
- 826 Safford Ave
- 8712 Hiel St
- 8723 Saint George St
- 818 Safford Ave
- 8720 Hiel St
- 8711 Hiel St
- 8731 Saint George St
- 8719 Hiel St
- 8728 Hiel St
- 810 Safford Ave
- 8702 Kelso St
- 8727 Hiel St
- 8736 Hiel St